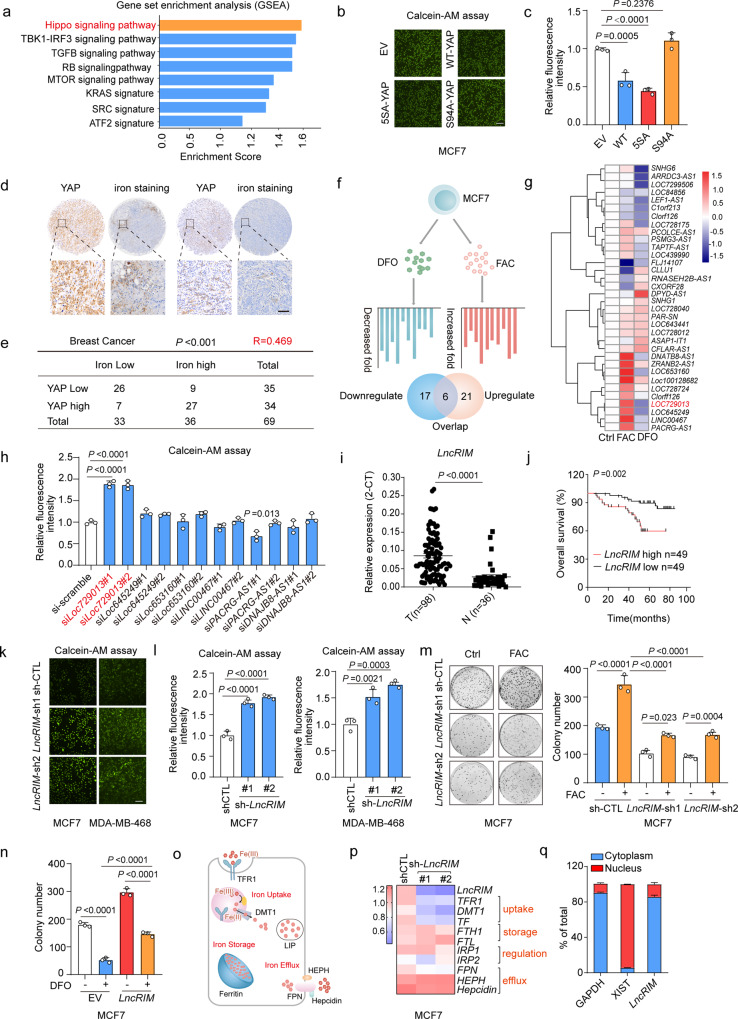
Fig. 1. LncRIM regulates iron metabolism and breast cancer progression.
a Gene set enrichment analysis using the C6 canonical pathways Broad MsigDB database on gene expression data compared control and LCN2 knockdown MDA-MB-231 cell lines. b, c Calcein-AM analysis cellular iron level of MCF-7 cells transfected with indicated YAP mutant (b). Scale bar, 100 μm. Values were normalized to control group (c). (mean ± SD, n = 3, One-way ANOVA analysis). d Enhanced DAB iron staining (n = 69) and immunohistochemistry staining of YAP (n = 69) in breast cancer tissue arrays. Scale bar, 100 µm. e Correlations between the YAP and iron levels in human breast tumors were analyzed. two-sided chi-square test; R, correlation coefficient. f, g Schematic illustration of the analysis of lncRNA profiles stimulated with FAC (100 μM) or DFO (100 μM) from the human Lincode® siRNA library into MCF-7 cells that were engineered with a TEAD-driven luciferase reporter (f). The representative candidates were assayed by RT–qPCR (g) (mean ± SD, n = 3, One-way ANOVA analysis). h Calcein-AM analysis the cellular iron level of HEK-293T with candidate lncRNAs knockdown. Values were normalized to control group. (mean ± SD, n = 3, two-sided Student’s t test). (i) RT–qPCR detected the LncRIM expression in breast cancer tissues (n = 98) and paired adjacent tissues (n = 36). The horizontal black lines represent median values. (mean ± SD, two-sided Student’s t test). j Kaplan–Meier analysis of overall survival of breast cancer patients with low versus high expression of LncRIM (n = 98, Gehan–Breslow test). k, l Calcein-AM detected cellular iron level of control and LncRIM knockdown MCF-7 cells (k). Scale bar, 100 μm. Values were normalized to control group (l). (mean ± SD, n = 3, One-way ANOVA analysis). m Colony formation assay of control and LncRIM knockdown MCF-7 cells with or without 200 µM FAC stimulation (mean ± SD, n = 3, Two-way ANOVA analysis). n Colony formation assay of EV and LncRIM overexpressed MCF-7 cells treated with or without DFO (100 µM) (mean ± SD, n = 3, Two-way ANOVA analysis). o Graphical illustration of the main proteins involved in the cellular iron homeostasis. p RT-qPCR and Heatmap detected the expression of iron metabolism-related genes in control and LncRIM knockdown MCF-7 cells. (mean ± SD, n = 3, One-way ANOVA analysis). q RT–qPCR detection of LncRIM expression in cytoplasmic and nuclear fractions. (mean ± SD, n = 3).

