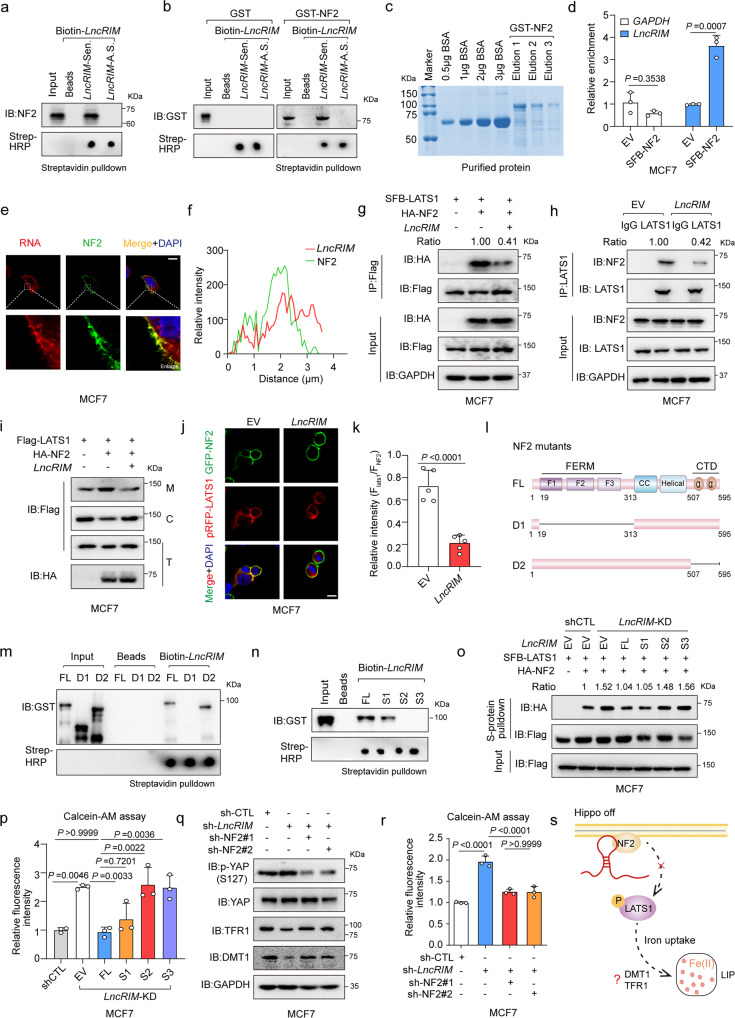
Fig. 2. LncRIM interacts with NF2 to inactive LATS1 kinase.
a In vitro-transcribed biotinylated LncRIM sense (Sen.) or antisense (A.S.) transcripts were incubated with MCF-7 cell lysates for RNA pull-down assay. The biotin-RNAs was detected by dot blot using streptavidin-HRP. b In vitro-transcribed biotinylated LncRIM transcripts were incubated with GST-NF2 recombinant proteins for RNA pull-down assay. c Coomassie staining gel of the purified GST-NF2 protein. d The RIP assay and RT-qPCR were performed to assess the enrichment of NF2 on LncRIM. (mean ± SD, n = 3, two-sided Student’s t test). e, f RNA FISH assay and immunofluorescent staining to examine the localization of LncRIM and NF2 (e). A line scan of the relative fluorescence intensity of the signal (dotted line) is plotted to show the peak overlapping (f). The LncRIM probe was labeled with Cy3 (Red) and NF2 was detected with Alexa Fluor 488(Green). Scale bar, 10 μm. g, h Co-IP analysis for the interaction between LATS1 and NF2 in LncRIM overexpressed MCF-7 cells. i Analysis of LATS1 subcellular localization in the fractions of MCF-7 cells with overexpression of LncRIM (M: membrane, C: cytoplasm, T: total). j, k Immunofluorescent staining to detect the interaction between LATS1 (Red) and NF2 (Green) in control and LncRIM overexpressed MCF-7 cells. Scale bar, 10 µm. (mean ± SD, n = 5, two-sided Student’s t test). l Schematic illustration of NF2 structures and truncated mutants. m Wild type and NF2 mutant recombinant proteins were incubated with in vitro-transcribed LncRIM, and pulled down by streptavidin beads. n Immunoblot detection of GST-NF2 protein retrieved by in vitro–transcribed biotinylated LncRIM and different LncRIM truncations (S1, S2, and S3). o Co-IP assay was performed to detect the interaction of LATS1 and NF2 with different truncations of LncRIM. p Calcein-AM analysis cellular iron level of MCF-7 cells transfected with different truncations of LncRIM. The values were normalized to the control group. (mean ± SD, n = 3, One-way ANOVA analysis). q, r The DMT1, TFR1 expression (q) and the cellular iron level (r) of control and LncRIM knockdown MCF-7 cells with NF2 silence. The values were normalized to the control group (r). (mean ± SD, n = 3, One-way ANOVA analysis). s Graphical illustration of LncRIM-NF2 axis in cellular iron metabolism.

