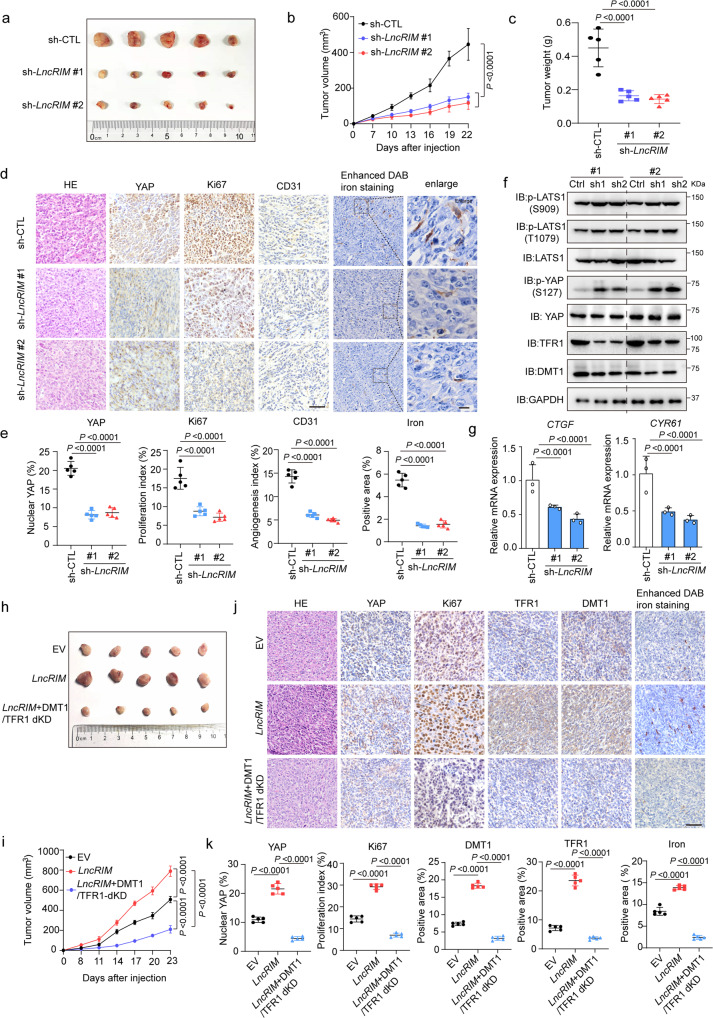
Fig. 5. LncRIM-YAP axis-mediated iron metabolism promotes tumor progression.
a Xenograft mouse model using control or LncRIM knockdown MDA-MB-468 cells. In vivo generated tumors are shown. b, c Analysis of tumor volume (b) and weight (c) in xenograft mouse model are shown. The data are presented as the mean ± SD of n = 5 mice per group, Two-way/One-way ANOVA analysis. d, e Representative IHC staining and enhanced DAB iron staining of randomly selected tumors from mice subcutaneously injected with the indicated stably transduced MDA-MB-468 cells (d). Scale bar, 100 µm. The relative intensities were quantified by ImageJ (e). The data are presented as the mean ± SD of n = 5 mice per group, One-way ANOVA analysis. f Immunoblot detection of YAP, LATS1, DMT1 and TFR1 expression in randomly selected xenograft tumors. g The YAP target genes expression in the indicated subcutaneous xenograft tumors was examined by RT-qPCR. (mean ± SD, n = 3, one-way ANOVA analysis). h, i Nude mice were injected with control, LncRIM overexpressed, or double knockdown of DMT1/TFR1 with overexpression of LncRIM MDA-MB-468 cell lines. In vivo generated tumors are shown (h). The tumor volumes were assessed (i). The data are presented as the mean ± SD of n = 5 mice per group, two-way ANOVA analysis. j, k Representative IHC staining and enhanced DAB iron staining of randomly selected tumors from mice subcutaneously injected with the indicated stably transduced MDA-MB-468 cells (j). Scale bar, 100 µm. The relative intensities were quantified by ImageJ (k). The data are presented as the mean ± SD of n = 5 mice per group, one-way ANOVA analysis.

