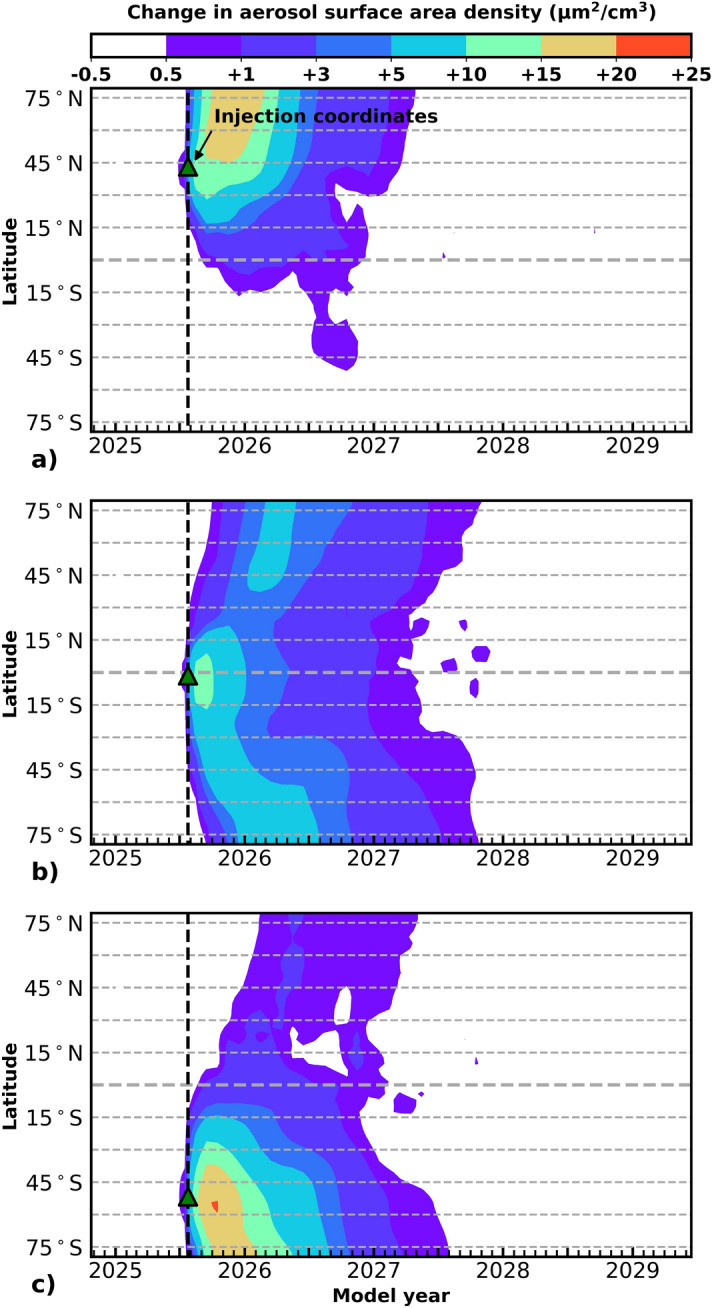
Figure 2.

Aerosol surface area density (SAD) response to 5 Tg SO injection (SSP3-70 July 25, 2025) as a function of latitude. In all panels, computed metrics reflect the difference in SAD between the volcanic eruption perturbation model ensemble and the baseline control model ensemble shown for a 4-year time-horizon. Total column response of aerosol SAD is indicated by the colorbar. The latitudes of eruption are: (a) 42N, (b), 1S and (c) 50S. Latitude and date of each SO injection are indicated by a green triangle and a dashed line.
