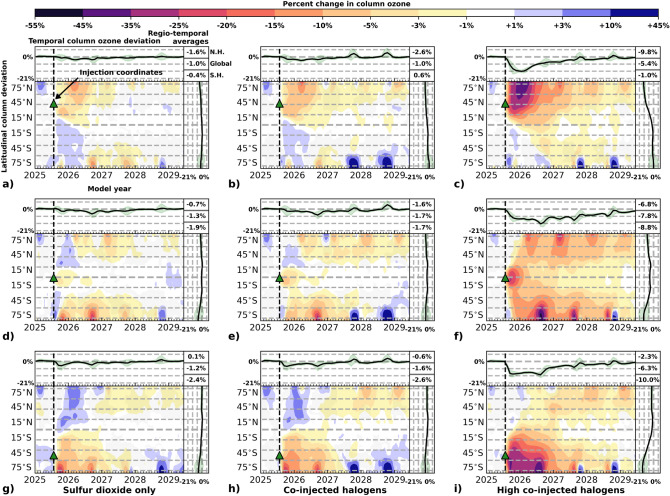
Figure 6.
Ozone response to volcanic eruptions of varying halogen injection. Left column, panels (a), (d), and (g): Sulfur dioxide only eruptions in which volcanic SO (5 Tg SO) is injected into the stratosphere. Center column, panels (b), (e), and (h): Intermediate co-injected halogen eruptions in which 5 Tg SO, 0.05 Tg HCl, and 0.0005 Tg HBr are injected into the stratosphere. Right column, panels (c), (f), and (i): High co-injected halogen eruptions in which 5 Tg SO, 0.5 Tg HCl, and 0.005 Tg HBr are injected into the stratosphere. Volcanic eruption scenarios (SSP3-70 July 25, 2025) are presented for three latitudes: (a)–(c) 42N, (d)–(f) 1S, and (g)–(i) 50S. In all graphical panels, computed metrics reflect the difference between the eruption perturbation ensemble and the control ensemble with a 4-year time-horizon. Main, bottom left panels: Response of total column ozone in percent as indicated in the colorbar (note that colorbar levels increment non-linearly). Top left panels: Global average response of total column ozone over time as indicated in the left scale. Bottom right panels: Response of total column ozone average over time versus latitude. Green shading in the top left and bottom right panels illustrates variation (2) in the eruption perturbation ensemble; note that the increment between dashed lines in these panels is 7%. Top right corner panel: 3-year extra-polar hemispherical average (0–80N and 0–80S) and global average (80S–80N) of the total column ozone deviation, ordered as NH, Global, SH. Panels (a)–(i): Latitude and date of SO and halogen injection are indicated by a green triangle and a dashed line.

