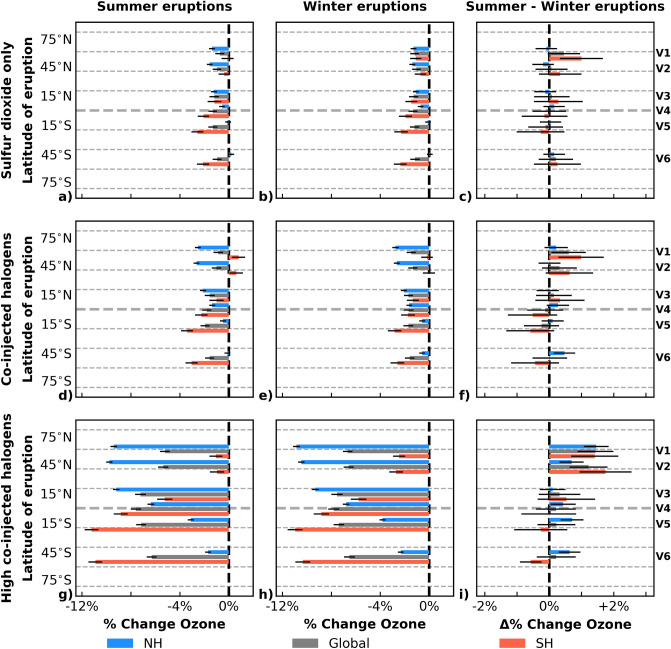
Figure 7.
Ozone response dependence on seasonality of a volcanic eruption (SSP3-70 January/July 2025). Global (grey) and hemispherical (NH: blue, SH: red) changes in percent ozone over 3 years after a volcanic eruption shown for summer (left column) and winter (middle column) eruptions. The difference of summer–winter is shown in the right column. Panels (a)–(c) show the sulfur dioxide only eruptions, (d)–(f) the intermediate co-injected halogen eruptions, and (g)–(i) the high co-injected halogen eruptions. Volcanic eruption scenarios are divided into seasons for the NH and SH, with January representing NH winter and SH summer and July representing NH summer and SH winter. Within each panel, V1–V6 indicates eruption latitude: 58N, 42N, 14N, 1S, 17S, and 50S, respectively. Uncertainty whiskers are plotted in black, representing 1.

