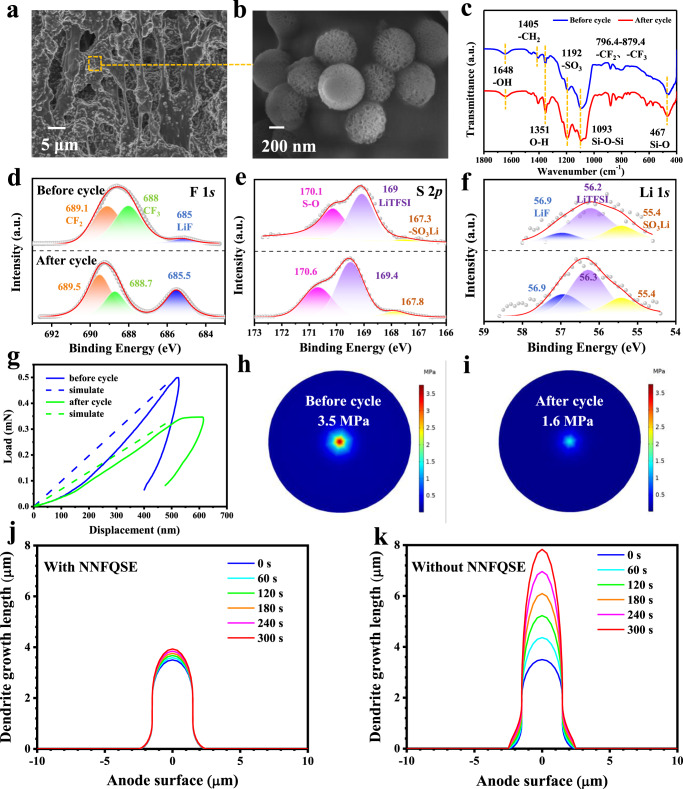
Fig. 5. Characterization of NNFQSE SiO2-SO3Li/PVDF-HFP before and after 5000 h cycling.
a Cross-section SEM images; b enlarged view of a; c Infrared spectrum among the region of 400–1800 cm−1; XPS analysis: d F 1 s; e S 2p; f Li 1 s; g Nano-indentation test and simulated load-displacement curve. The horizontal coordinate corresponds to lithium dendrite length, and the vertical coordinate corresponds to the force; h, i COMSOL simulation of the electrolyte deformation. The pressure cloud diagram under the same deformation before h and after i cycling; COMSOL simulations of Li dendrite growth during prolonged time of 300 s j with NNFQSE or k without NNFQSE.

