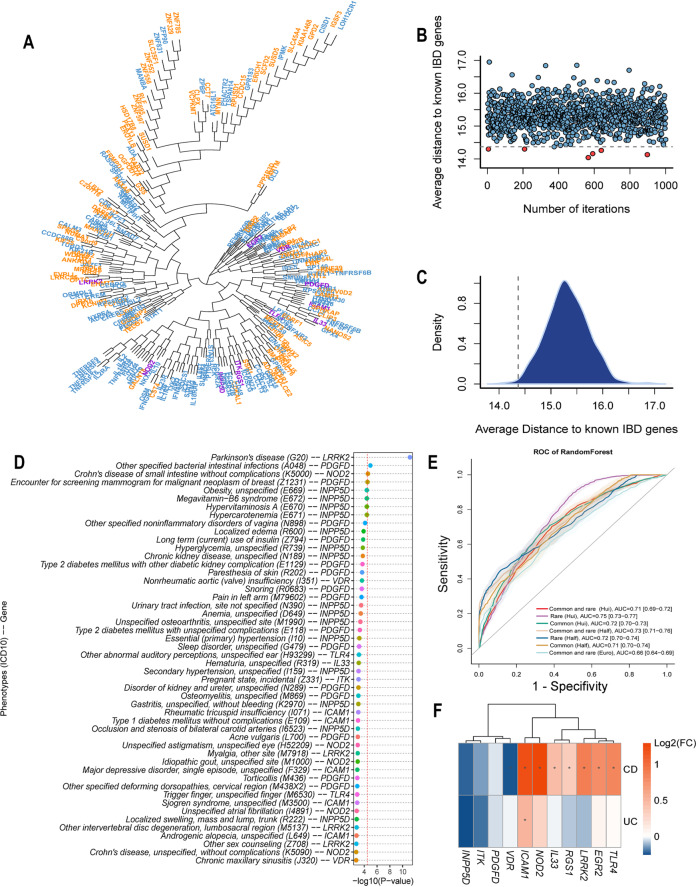
Fig. 3. IBD candidate genes are biologically proximate to IBD known genes. Gene level PheWAS replicated IBD-associated genes in an independent cohort and demonstrated that IBD genes are also related to other immune responses.
A Clustering IBD candidate genes (blue) and IBD known genes (orange) according to biological relatedness by Functional Genomic Alignment function using the HGC. The 11 pathway identified genes (Fig. 2A) are indicated in violet. The candidate genes did not form distinct clusters; rather, they were mixed with IBD known genes. B A dot plot representing the average distance from a randomly selected gene set (127 genes) to known IBD genes. The gray dashed line represents the cutoff in terms of the average biological distance between IBD-associated genes and IBD known genes. With genes randomly resampled 1000 times, 6 random gene sets have lower average distances; hence, the empirical P value of our candidate genes being empirically associated with IBD as a group is 0.006. P value is unadjusted and the statistical test is two-sided. C A density plot for all average distances in a resampling test; the percentiles at 2.5% and 97.5% are 14.27 and 14.48, respectively. The vertical dashed line denotes the cutoff in plot (B). D Gene level PheWAS analysis on the 11 candidate genes using 40 K whole exome sequencing samples from the Mount Sinai BioMe Biobank. The top 50 associations are displayed, the red dashed line denotes two-sided unadjusted P = 0.01 in the gene level PheWAS. E Comparisons of prediction results on IBD individuals using polygenic risk scores derived from different variant sets. Receiver Operating Characteristic (ROC) curves of PRS derived from different variant sets (solid lines), and the 95%CI (bands). Names in brackets indicating GWAS summary statistics used: Hui, AJ IBD GWAS from Hui’s study38; Half, AJ IBD GWAS using half of our IBDGC samples; Euro, European IBD GWAS from Liu’s study2. Values indicate the estimated AUCs and their 95% confidence intervals (in square brackets). F RNA-seq log2 fold change of the 11 IBD-associated genes identified by all four pathway analyses in CD, UC, and IBD versus controls, respectively (*P < 0.05). P values are unadjusted and statistical tests are two-sided. Exact P values are provided in Supplementary Data 12.

