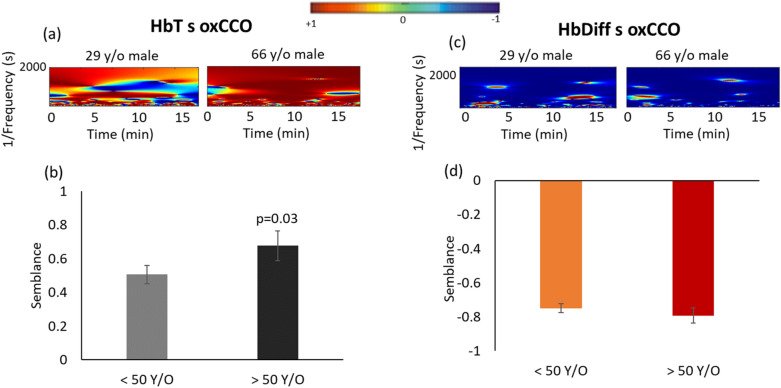
Figure 3.
Semblance between mitochondrial oxidative metabolism (oxCCO) with total and difference hemoglobin signals (HbT and HbDiff markers for retinal blood volume and oxygenation, respectively) in dark. (a) HbT s oxCCO is greater in the 66-year-old (y/o) male compared to the 29 y/o male shown by predominantly red color representative of semblance + 1 ~ zero phase difference across all frequencies over time. (b) Group data for HbT s oxCCO averaged over all frequencies also showing significantly stronger semblance between total retinal blood volume with mitochondrial metabolism in subjects > 50 y/o (p = 0.03). (c) Showing a consistently antiphase relationship between HbDiff and oxCCO signals in dark in representatives 29 and 66 y/o male subjects (HbDiff s oxCCO predominantly blue across all frequencies, semblance −1 ~ 180° phase difference in both subjects). (d) Group data averaged across all frequencies showing no difference in HbDiff s oxCCO between < 50 and > 50 y/o, signifying a strong decoupling between retinal oxygenation and mitochondrial metabolism during dark adaptation across all ages. The color maps are produced using a MATLAB program, comparing time series using Semblance Analysis, version 1.0.0.0, found at https://uk.mathworks.com/matlabcentral/fileexchange/18409-comparing-time-series-using-semblance-analysis.

