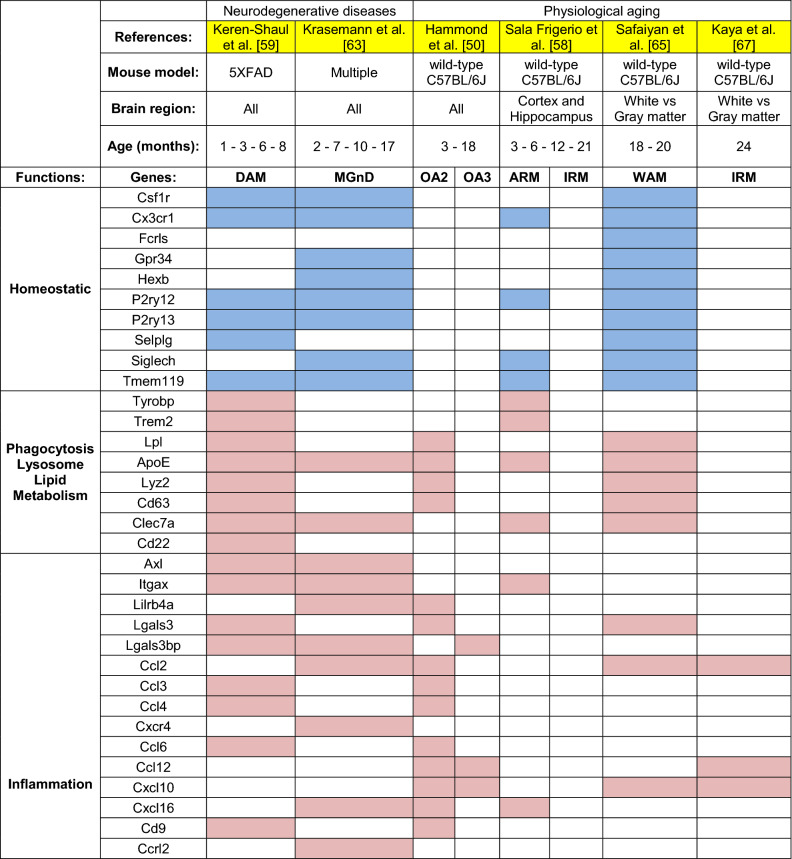
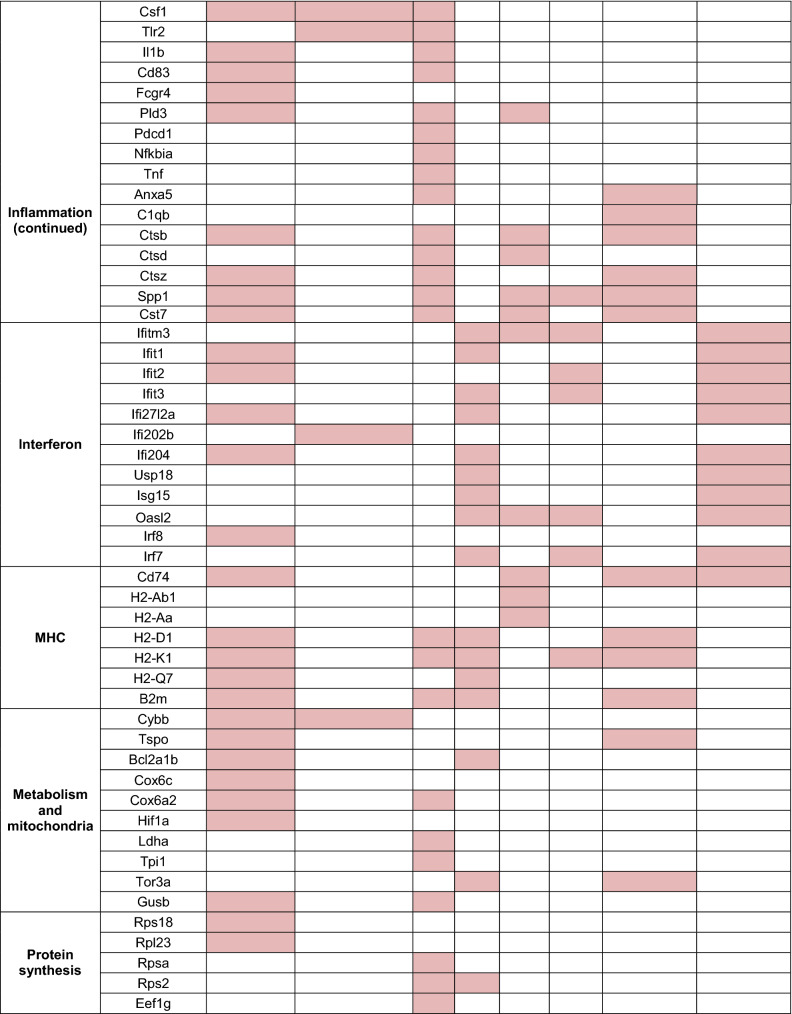
Table 1.
Summary of microglia genes enriched in mouse models of healthy aging and neurodegenerative diseases. Mouse microglia signatures identified in different contexts and sorted based on disease state (healthy aging/neurodegeneration), mouse models and brain areas investigated. Data shown in the table were mined from the available sources published by each respective study. For Keren-Shaul et al. [59] and Hammond et al. [50], a fold-change threshold of 1.5 (or − 1.5) was applied when mining data. Genes left as blank were below the 1.5-fold change or were not reported. For Krasemann et al. [63], Sala Frigerio et al. [58], Safaiyan et al. [65], Kaya et al. [67], genes that were not reported in the published sources were left as blank. Each gene cluster is classified according to the relative gene function and highlighted in pink, if upregulated, or blue, if downregulated, based on the enrichment analysis in each study. Genes that do not fall in the mentioned categories were excluded for simplicity. DAM, disease-associated microglia [59], MGnD, microglial neurodegenerative phenotype [63]; OA2 and OA3: Old activated microglia 2 and 3 [50]; ARM, activated responsive microglia [58]; IRM, interferon-responsive microglia [58, 67]; WAM, white-matter-associated microglia [65]


