Fig. 2.
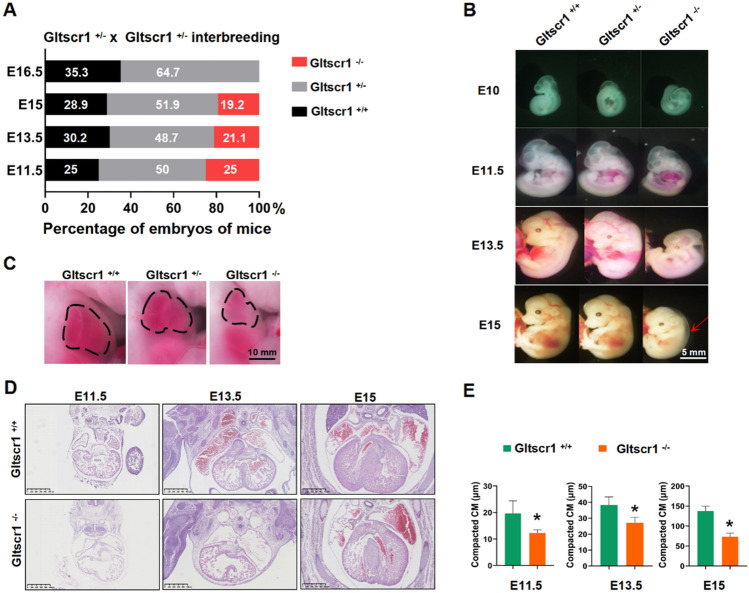
Gltscr1-deficient embryo results in cardiac defects. A Genotyping analysis from Gltscr1+/− and Gltscr1+/− interbreeding. B Representative images of gross appearance in Gltscr1+/+, Gltscr1+/−, and Gltscr1−/− embryos at E10 to E15. The arrow indicates the peripheral edema in Gltscr1−/−. Scale bar: 5 mm. C Representative images of gross appearance in Gltscr1+/+, Gltscr1+/−, and Gltscr1−/− embryos at E13.5. The dashed area indicates the heart area. Scale bar: 10 mm. D Representative H&E staining images of embryonic heart tissues collected at E11.5, E13.5, and E15 from Gltscr1+/+ and Gltscr1−/− embryos. Scale bar: 500 µm. E Quantification of compacted cardiomyocyte (CM) (D) was performed using ImageJ software. Data were shown as the mean ± S.D.; n = 18 sections from 3 independent experiments. *P < 0.05 compared to control (two-tailed Student’s t test were used)

