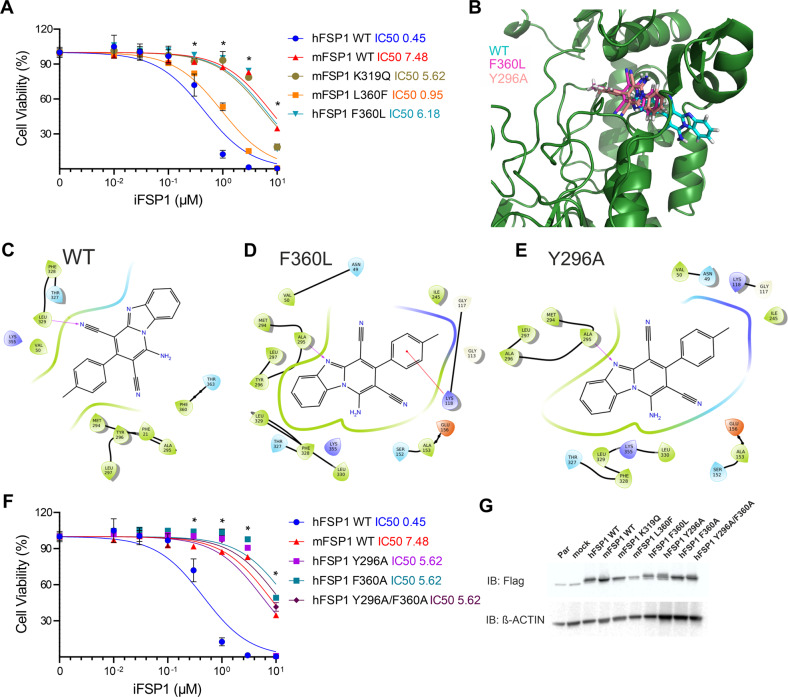
Fig. 2. F360 of FSP1 is essential for iFSP1 target engagement.
A Dose-response toxicity to iFSP1 in Pfa1 Gpx4−/− overexpressing hFSP1, mFSP1 and single point mutants (mFSP1K319Q, mFSP1L360F and hFSP1F360L). B Binding modes for iFSP1 obtained from docking the ligand to hFSP1 WT or to different mutants. The backbone of hFSP1 WT is represented in green. Cyan: iFSP1 bound to hFSP1 WT, dark pink: iFSP1 bound to mutants F360L or F360I, light pink: iFSP1 bound to mutants Y296A or F360I/Y296A. Only one FSP1 structure (hFSP1 WT) is represented. Interaction diagrams between iFSP1 and hFSP1 WT (C), mutant F360L (D) and mutant Y296A (E). Purple arrows indicate hydrogen bonds. F Dose-response toxicity to iFSP1 in Pfa1 overexpressing hFSP1, mFSP1 and the mutants hFSP1Y296A, hFSP1F360A and hFSP1Y296A/F360A. G Immunoblot analysis of flag-tag, GPX4 and FSP1 in Pfa1 Gpx4−/− overexpressing hFSP1, mFSP1 and mutants. Cell viability data was monitored using Alamar blue. Data are presented as mean ± s.d. of n = 3 wells of a 96-well plate from one representative of three independent experiments; *p < 0.05; two-way analysis of variance (ANOVA).

