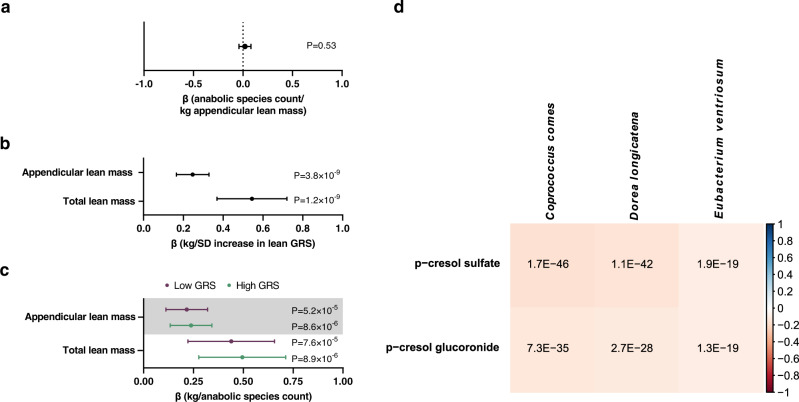
Fig. 2. Studies on the underlying nature of the associations between three anabolic species and appendicular lean mass (ALM).
a Two-sample Mendelian randomization (MR) analysis using genetically determined ALM as the exposure and the anabolic species count as the outcome. Forest plot of the point estimate (β values as change in anabolic bacteria count/kg increase in genetically determined ALM) and 95% confidence intervals (CIs) from a fixed effect inverse variance weighted MR (n = 4002). b Associations (gender- and age-adjusted) between ALM genetic risk score (GRS) and ALM and total lean mass in HUNT. Forest plot of the point estimates (linear regression β coefficient; β values in kg lean mass/standard deviation [SD] increase in ALM GRS) and 95% CIs (n = 4002). c Stratified evaluation of associations between anabolic species count and lean mass in subjects with low and high ALM GRS (divided by the median). Forest plot of the point estimates (linear regression β coefficient; β values in kg of lean mass per anabolic species count) and 95% CIs (n = 4002). d Partial Spearman’s rank correlations between bacterial species relative abundance and circulating levels of metabolites, adjusted for age, sex, place of birth, study site, microbial DNA extraction plate, and metabolomics delivery batch, in the dataset by Dekkers et al.32 (n = 8583). All tests are 2-sided. n refers to number of study participants.

