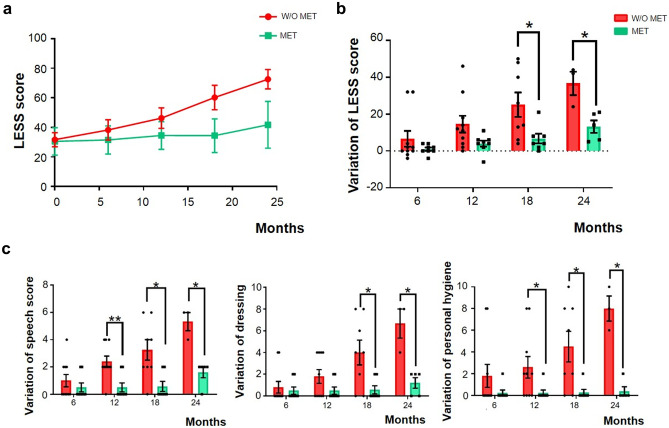
Fig. 5.
Metformin treatment slows the course of Lafora disease in patients. We compared the evolution of patients with Lafora disease who were receiving metformin (MET), to patients who were not (w/o MET) (a). We calculated the variation in the LESS score from the initial examination to 6, 12, 18, and 24 months of follow-up. Thus, to calculate all these variations, we always used the LESS score reported in the baseline follow-up as the reference (b). We show the most well-preserved alterations due to metformin administration (c). Data are shown as a mean of LESS score or a variation of these scores as received in the LESS ± SEM. A Student’s t-test was performed when we analyzed data at the initial examination and at 6, 12, and 18 months of follow-up. We used the Mann–Whitney non-parametric test when we studied data at 24 months. *p < 0.05; **p < 0.01

