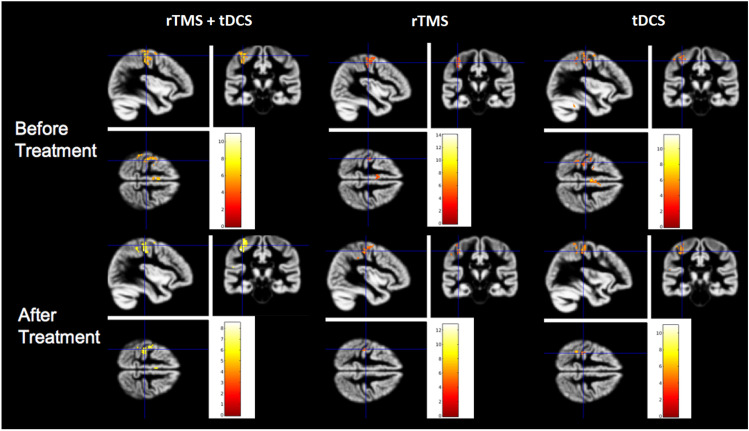
Fig. 6.
BOLD activation patterns during the motor task. The left column depicts the results combined for both rTMS and tDCS while the middle column illustrates the results for rTMS only and the right column for tDCS. The motor task induced significant activations in the contralateral sensori-motor cortex and the supplementary motor area (SMA), with no significant differences before (upper panel) or after one week of daily motor cortex stimulation (lower panel)

