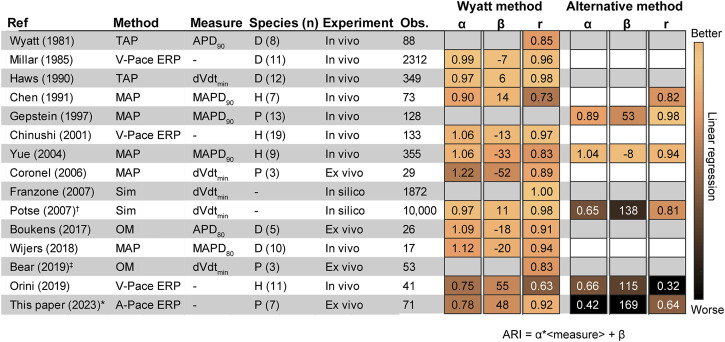
FIGURE 6.
Literature results comparing the invasive unipolar electrogram (UEG) T-wave to different outcome measures. (Wyatt et al., 1981; Millar et al., 1985; Haws and Lux, 1990; Chen et al., 1991; Gepstein et al., 1997; Chinushi et al., 2001; Yue et al., 2004; Coronel et al., 2006; Franzone et al., 2007; Potse et al., 2007; Boukens et al., 2017; Wijers et al., 2018; Bear et al., 2019a; Orini et al., 2019). The Figure shows Pearson’s r, the slope (α) and intercept (β) according to the equation ARI = α ⋅<local measure>+ β, i.e., for Orini (2019): RT = α ⋅V-pace ERP+ β (Figures 3, 4 for an example). †: Analysis only for positive T-waves. ‡: RT instead of ARI (Figure 2A). If pooled data on r, α and/or β were not available, a weighted average was calculated for separate experiments. D: Dog. H: Human. MAP: monophasic action potential. Obs.: number of observations. OM: Optical mapping. P: Pig. Sim: Simulation. TMP: transmembrane action potential. V-pace ERP/A-pace ERP: ventricular/atrial-paced effective refractory period (see text).

