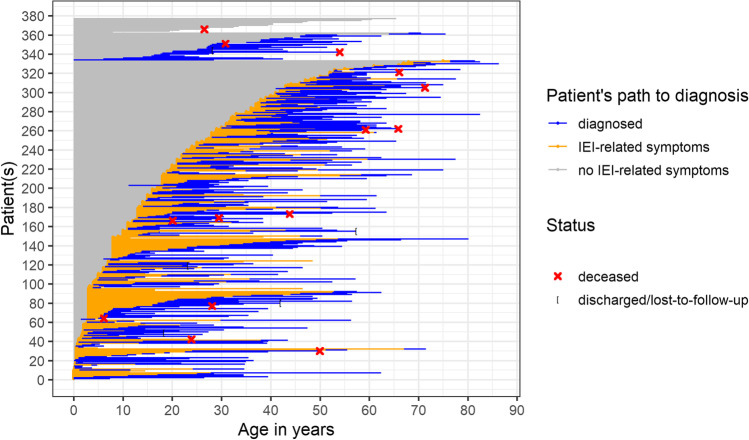
Fig. 3.
Patient’s path to diagnosis. Depicted are patients who reported symptoms related to inborn error of immunity (IEI) (n = 385). For patients at the top, date of symptom onset (n = 45) and/or date of diagnosis was unknown (n = 33) or they were genetically diagnosed before developing symptoms (n = 1). If only the partial information of the year was known, the middle of the year was used for the graph. In cases when the disease onset was given in a 5-year range, the middle of the range was used

