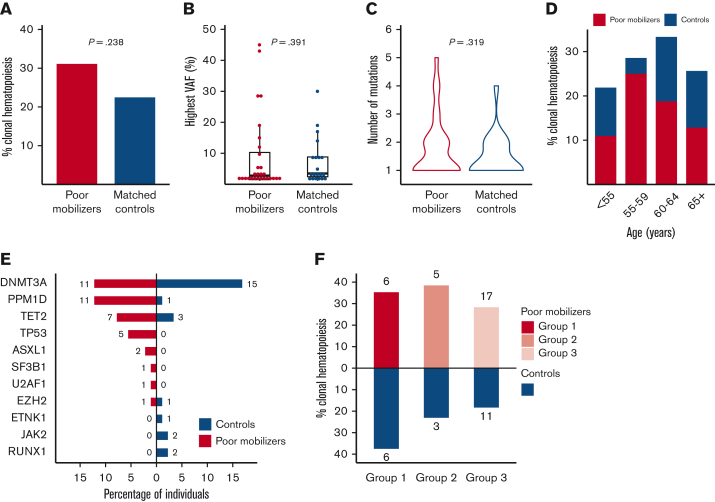
Figure 2.
Spectrum of CH detected in poor mobilizers and controls. (A) Prevalence of CH in 90 poor mobilizers and 89 matched controls. (B) Distribution in the highest VAF for poor mobilizers (red) and matched controls (blue) carrying CH. Boxplots indicate median, first, and third quartiles, with whiskers extending to 1.5× IQR. (C) Violin plot displaying the distribution in number of detected mutations in poor mobilizers (red) and controls (blue) carrying CH. (D) Prevalence of CH according to age (n = 179). Red, poor mobilizers (n = 90); blue, matched controls (n = 89). (E) Proportion of poor mobilizers and matched controls carrying specific gene mutations. The absolute number of individuals with the respective gene mutation is given. (F) Prevalence of CH in failure subgroups 1 (n = 17), 2 (n = 13) and 3 (n = 60), as compared with their respective matched controls.

