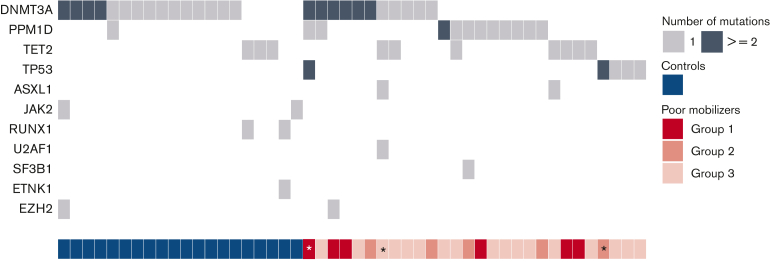
Figure 3.
Landscape of concurrent gene mutations in poor mobilizers and controls. Each row indicates a specific gene mutation, with columns representing individual patients. The darker shade indicates multiple mutations within the same gene. Subgroups of poor mobilizers are indicated. Individuals developing t-MNs are indicated by an asterisk.

