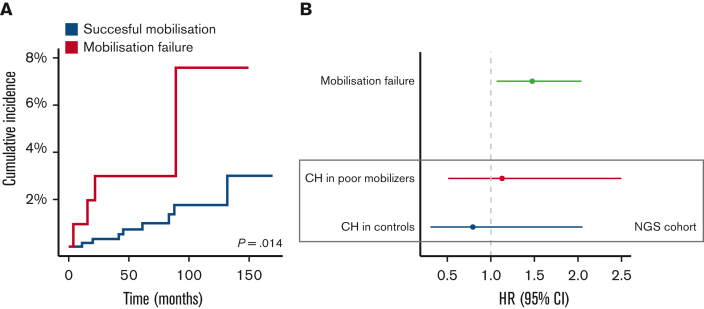
Figure 4.
Outcomes for poor mobilizers and controls. (A) Cumulative incidence of t-MNs among poor mobilizers (n = 106) and successful mobilizers (n = 670). (B) OS for poor mobilizers and controls. HRs for OS are shown for poor mobilization potential in the entire cohort (n = 776) in the upper graph. Within the case-control cohort with NGS data, HRs are shown for the presence of CH among cases (n = 90) and controls (n = 89) in the lower part of the graph. Forest plots display HR and 95% CI from Cox proportional hazard regression, corrected for age, sex, and major histological subtype.

