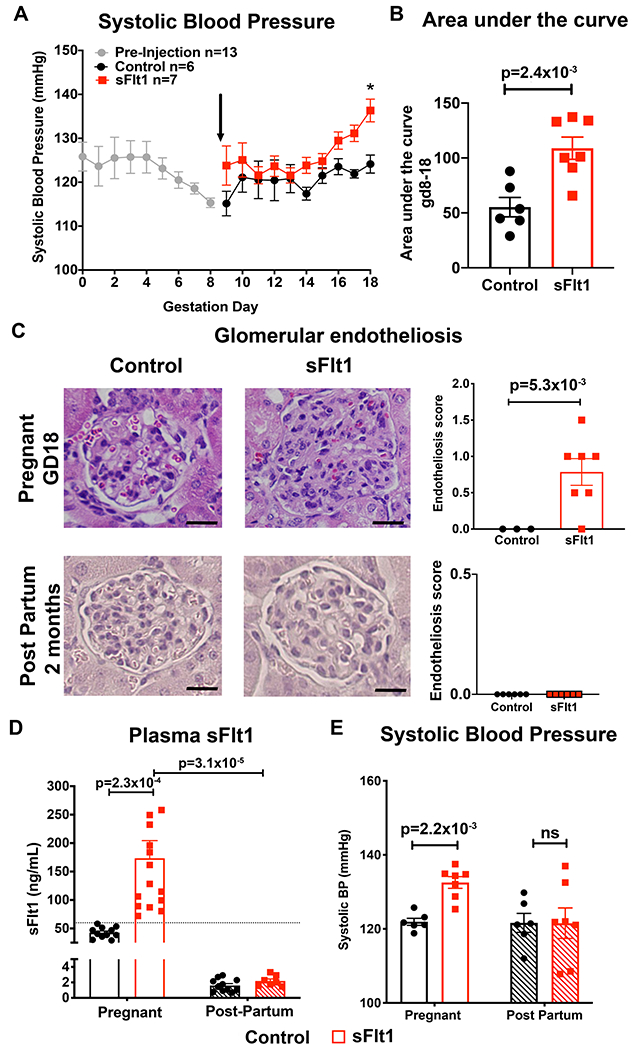
Figure 2. Exposure to elevated plasma sFlt1 in pregnant C57Bl/6 females is sufficient to phenocopy hypertension and renal damage seen in human preeclampsia.

(A) Systolic blood pressure (SBP) measured during pregnancy with radiotelemetry. Black arrow denotes randomization to injection with either “Control” (CMV-Null transgene) or “sFlt1” adenovirus at gestation day (GD) 9. All mouse BP data were averaged together prior to randomization (GD0-8, n=13). Control n=6, sFlt1 n=7. *p=1.6x10⁻² via two way repeated measures ANOVA with Sidak post hoc. (B) Area under the curve for SBP between GD8 before injection and the end of pregnancy (GD18) for each mouse. Control n=6, sFlt1 n=7. p value determined by unpaired student t test. (C) Representative images of glomeruli from kidneys at GD18 and 2 months post-partum, stained with hematoxylin and eosin. Average glomerular endotheliosis severity scored based on blinded analysis. Scale bar=20μm. Control n=3, sFlt1 n=7. p value determined by unpaired t-test with Welch correction. (D) Plasma was taken on GD17 and two months post-partum and sFlt1 measured using ELISA. Dashed line indicates exclusion value for sFlt1 levels of 60ng/mL. Control pregnant n=11, sFlt1 pregnant n=15, Control post-partum n=11 , sFlt1 post-partum n=7. p values determined via two way ANOVA with Sidak post hoc. (E) SBP at the end of pregnancy (GD17) and two months post-partum. Control pregnant n=6, sFlt1 pregnant n=7, Control post-partum n=6, sFlt1 post-partum n=7. p value determined by two way ANOVA with Sidak post hoc.
