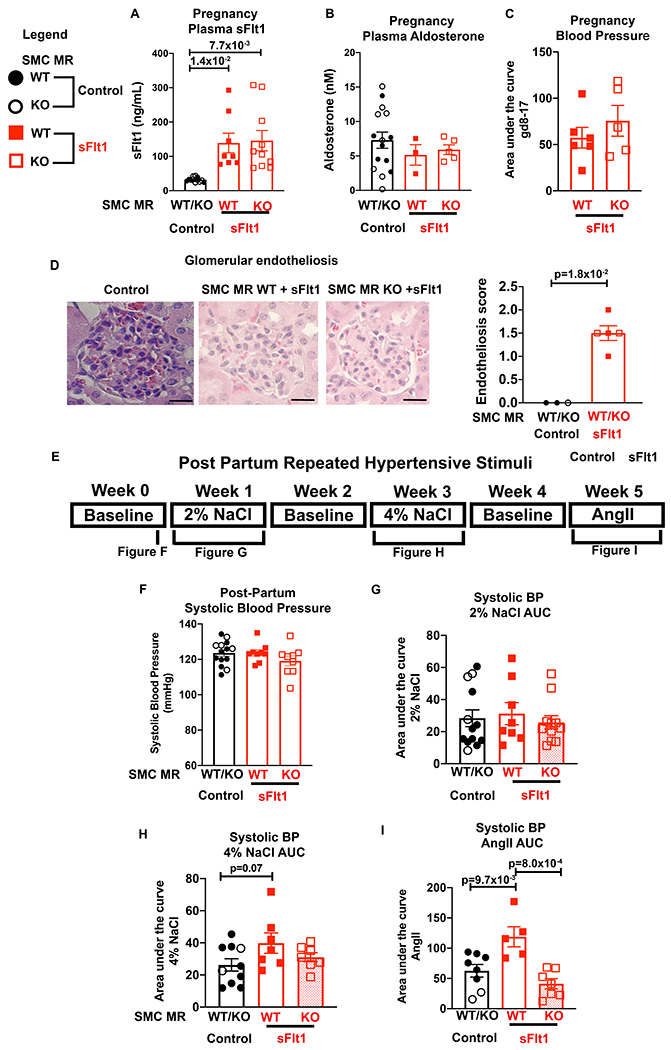
Figure 5. SMC-MR-KO mice exposed to high sFlt1 in pregnancy are protected from exacerbated response to post-partum hypertensive stress.

Pregnant SMC-MR-WT or SMC-MR-KO females were injected with Control or sFlt1 on GD9, allowed to deliver, and then exposed to hypertensive stimuli 2 months post-partum. Control injected females were combined for analyses as there were no statistically significant differences between WT and KO. (A) Plasma sFlt1 levels on GD17. Control n=12, WT sFlt n=8, KO sFlt n=10, p values determined via Welch’s one way ANOVA and Dunnett’s multiple comparisons. (B) Plasma aldosterone level on GD17. Control n=15, SMC-MR-WT sFlt n=3, SMC-MR-KO sFlt n=5. (C) Area under the curve for SBP between GD8 before injection and the end of pregnancy (GD17) for each mouse. SMC-MR-WT sFlt1 n=6, SMC-MR-KO sFlt1 n=5. (D) Representative images of glomeruli from mice on GD18, stained with hematoxylin and eosin. Scale bar=20μm. Average glomerular endotheliosis severity scored based on blinded analysis. Control n=3, WT sFlt n=3, KO sFlt n=2, p values determined by Mann-Whitney test. E) Timeline of post-partum hypertensive stimuli protocol. (F) SBP was measured via radiotelemetry two months post-partum. Control n=10, WT sFlt n=5, KO sFlt n=5. (G) The SBP area under the curve (AUC) for 2% NaCl. Control n=13, WT sFlt n=8, KO sFlt n=11. P=8.3x10⁻¹ via Kruskal-Wallis test. (H) The SBP AUC during 4% NaCl. Control n=10, WT sFlt n=7, KO sFlt n=7, p values determined by one way ANOVA and Dunnett’s post hoc test. (I) The SBP AUC during AngII. Control n=8, WT sFlt n=5, KO sFlt n=7, p values determined by one way ANOVA and Dunnett’s post hoc test. All SBP was compared to each individual mouse’s baseline.
