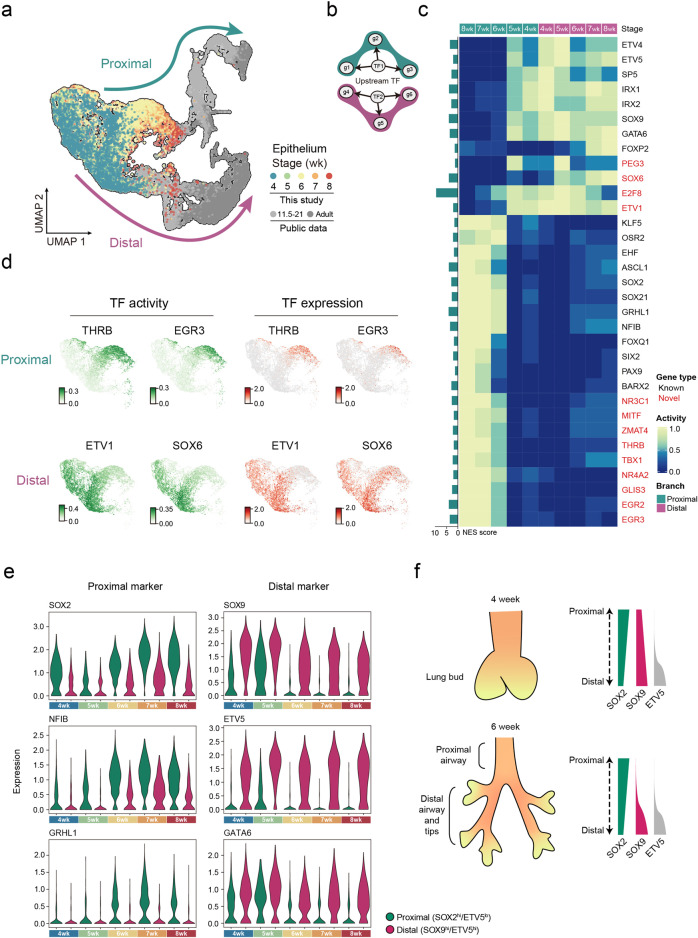
Fig. 2. TFs regulate early epithelial proximal–distal patterning.
a UMAP layout showing the integration of human epithelial scRNA-seq dataset from this study (colored by sample collection time points) and published datasets9,13 (colored by gray). Upper (green arrow) and lower (magenta arrow) trajectories represent proximal and distal epithelial lineages, separately. b Illustration of TF–gene regulons, inferred by SCENIC. c Heatmap showing temporal changes of regulon activity in proximal (green) and distal (magenta) branches. The bar graph on the left represents the Normalized Enrichment Score (NES) of each TF. Genes marked in red are newly identified TFs in this study. d TF activity (green) and expression (red) of proximal-specific THRB and EGR3 (above) and distal-specific ETV1 and SOX6 (bottom) during weeks 4–8 are projected on UMAP. SCENIC-generated TF activity, represented by AUC score, reflects the co-expression strength of TF and its target genes. e Violin plots showing the expression of the SOX2, NFIB, GRHL1, SOX9, ETV5 and GATA6 in EPI_SOX2hi/ETV5lo and EPI_SOX9hi/ETV5hi cells from weeks 4–8. f Illustrations of the proximal–distal patterning and marker gene expression.

