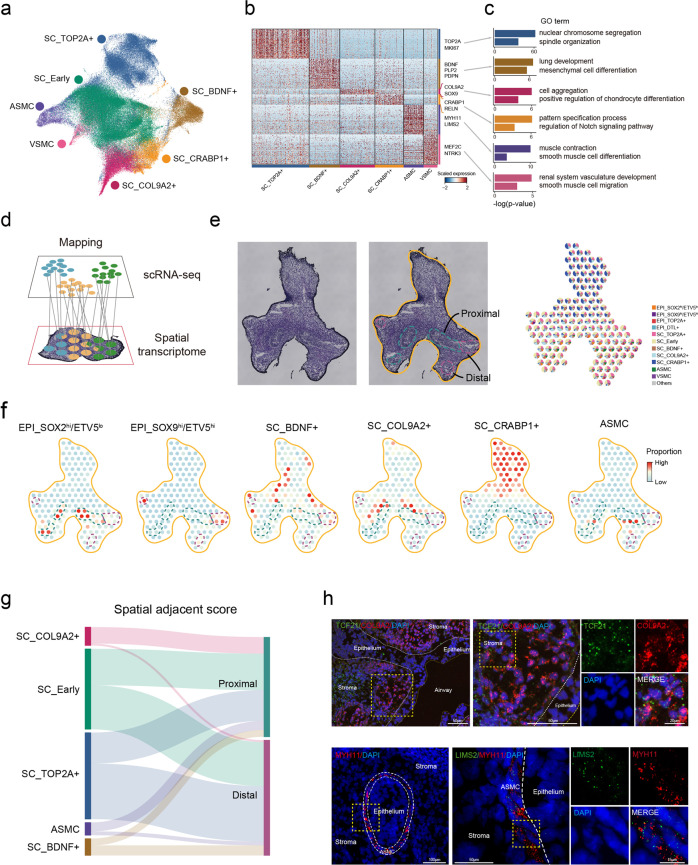
Fig. 3. Multiple stromal cell types exhibit proximal–distal spatial heterogeneity.
a Seven stromal cell subtypes were identified based on Leiden clustering (r = 0.3). b Heatmap showing differentially expressed genes (DEGs) of six stromal cell subtypes, with no DEGs for SC_Early (Wilcoxon rank-sum test, P value < 0.01). c Bar plots showing the GO terms enriched in six stromal cell subtypes. GO enrichment was performed by clusterProfiler. d Illustration of mapping single-cell transcriptome data to spatial transcriptome data (10× Visium) using Tangram algorithm. e Frozen section of a 6-week human lung (left panel). The illustration in the middle panel shows the outline of lung (colored by orange), the proximal epithelium (colored by green) and the distal epithelium (colored by magenta). Pie plots show the proportion of cell types mapped to each Visium spot from single-cell transcriptome data (right panel). f Dot plots showing the proportion of two epithelial cell types and four stromal cell types mapped to 10× Visium spots. The colored dash lines highlight the proximal and distal regions as illustrated in e. g Sankey plot showing the spatial adjacency of stromal cell types and two epithelial cell types. The line indicates the proportion of stromal subtypes in the epithelium-located spots in the proximal or distal region and the surrounding spots, with thicker lines indicating more stromal cells adjacent to the proximal or distal epithelium, and vice versa (Supplementary information, Table S11; see Materials and Methods). The absence of a connection between stromal and epithelial subtypes means no proximity. h smiFISH showing the expression of COL9A2 (red) and TCF21 (green) in SC_ COL9A2+ along the bronchus, and LIMS2 (green) and MYH11 (red) in ASMC surrounding epithelial cells in the lung at week 8. Data are representative of at least three independent smiFISH experiments.

