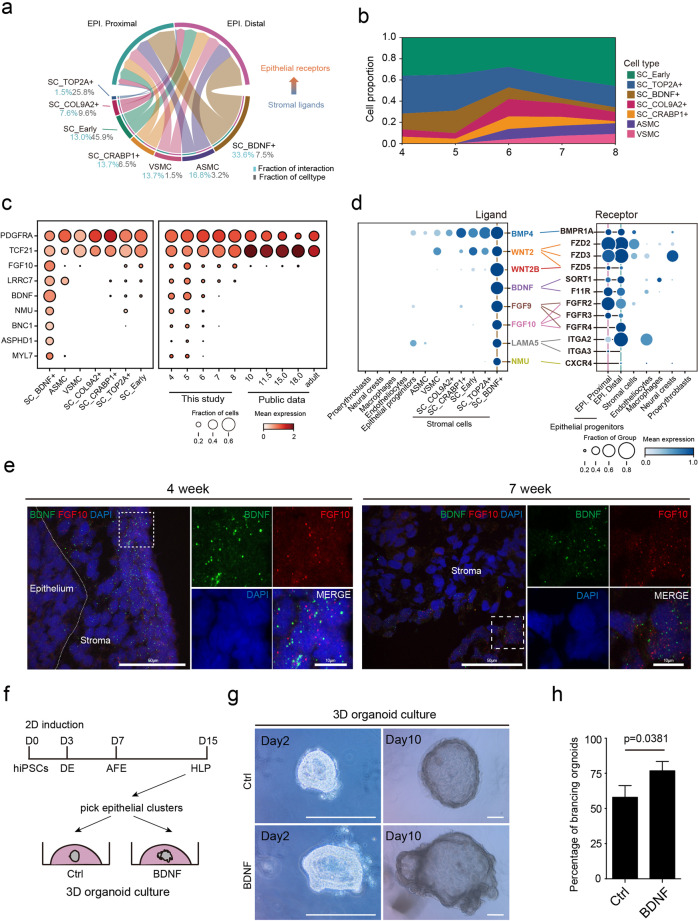
Fig. 4. SC_BDNF+ stromal cells provide signals for early lung epithelial development.
a Circos plot illustrating significant ligand–receptor interactions among stromal cells and epithelial cells, determined by permutation test (see Materials and Methods). The percentage in gray represents the proportion of ligand–receptor pairs of each stromal subtype; the percentage in blue represents the proportion of each stromal subtype in all stromal cells. EPI epithelial progenitors. b Stack plot showing the cell proportion of seven stromal subtypes during weeks 4–8. c Dot plot showing the specific gene expression profile of SC_BDNF+ across stromal cell types (left frame) and developmental stages (right frame; weeks 4–8, this study; after week 10, previous studies9,13,18). The size and color of each dot represent the expression percentage and expression level of the indicated marker gene within each cell type (left frame) and at each time point (right frame), respectively. d Dot plot showing the expression percentage and level of ligands (left) and receptors (right) among stromal and epithelial cell types, which highlights a high ligand–receptor interaction between SC_BDNF+ and epithelial cells. Colored lines connect ligand–receptor pairs. e smiFISH (left) showing the expression of BDNF and FGF10 in a group of stromal cells located around the epithelial cells and in the border region of the lung at week 4 while only in the border region at week 7. Data are representative of at least two independent smiFISH experiments. Scale bars, 50 μm (long), 10 μm (short). f Schematic diagram showing human lung epithelial organoids generated from hiPSCs and used for the validation of BDNF effects. DE definitive endoderm, AFE anterior foregut endoderm, HLP human lung progenitors. g Representative morphologies showing that BDNF promotes human lung organoid branching compared with the control group. Data are representative of 10–15 organoids from each of three independent experiments. Scale bars, 250 μm. h Quantification of the percentages of branching organoids upon the addition of BDNF. Data are means ± SD, n = 3 independent experiments. Unpaired Student’s t-test, P < 0.05.

