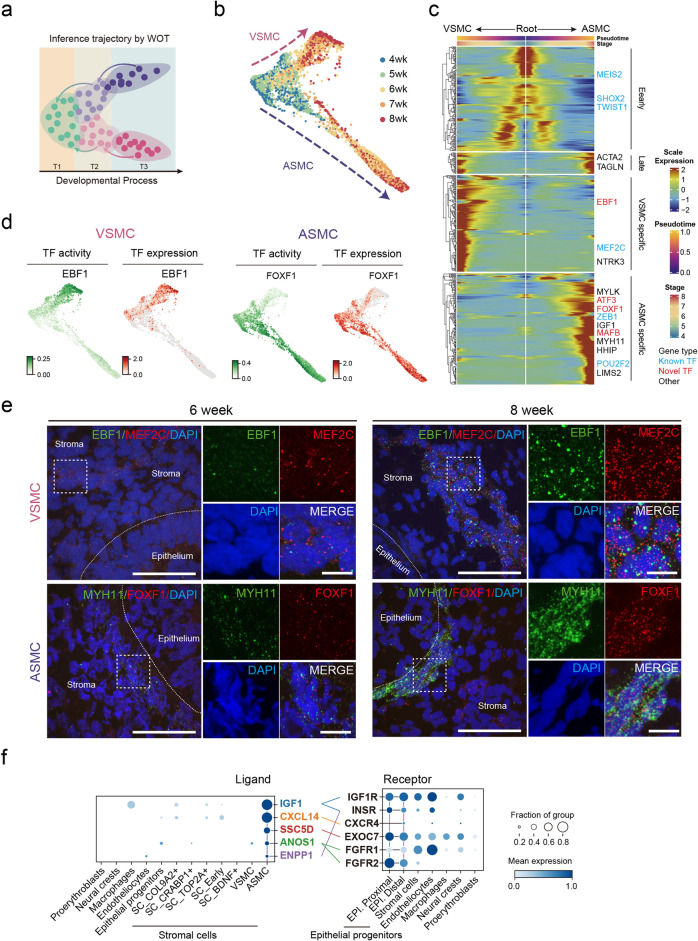
Fig. 5. The developmental trajectory inferences of ASMC and VSMC.
a Schematic diagram of WOT, an approach for trajectory inference using time-course information. b Force-directed layout embedding (FLE) to visualize the WOT-inferred VSMC and ASMC developmental trajectories, colored by time points. Upper (red arrow) and lower (purple arrow) trajectories represent VSMC and ASMC lineages, respectively. c Heatmap showing the dynamics of gene expression along Palantir pseudotime of ASMC and VSMC development. Genes marked in blue are known TFs, and those in red are newly identified TFs in this study. d TF activity and expression of VSMC-specific EBF1 (left) and ASMC-specific FOXF1 (right) were projected on FLE layout. TF activity reflects the co-expression strength of TF and its target genes. e smiFISH showing the expression of EBF1 (green) and MEF2C (red) in VSMC and MYH11 (green) and FOXF1 (red) in ASMC in the lung at weeks 6 and 8, respectively. Data are representative of at least two independent smiFISH experiments. Scale bars, 50 μm (long), 10 μm (short). f Dot plots showing the expression percentage and level of ligands (left) and receptors (right) between the providers (i.e., stromal cells including ASMC) and the recipients (i.e., epithelial cells). Colored lines connect ligand–receptor pairs.

