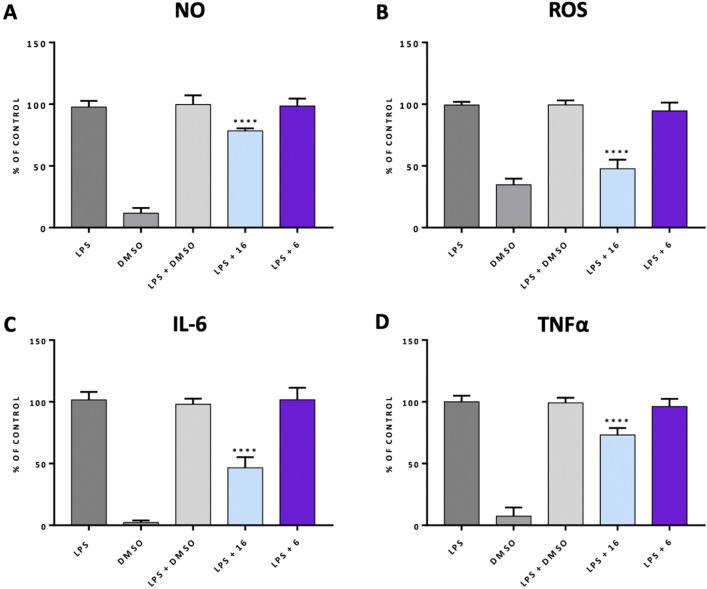
Figure 4.
Determination of anti-inflammatory activity of 16 in comparison to the activity of 6. Pretreatment with 16 or 6 (10 μM), DMSO (0.1%, v/v) for 1 h followed by incubation with LPS for 18 h and measurement of nitric oxide (A), reactive oxygen species (B), IL-6 (C), and TNF-α (D). The results are reported as a percentage of the maximum cellular response to the LPS stimulation. The reported values are represented as the mean ± SD. To determine the differences between the treatment groups and the LPS-treated group, a one-way ANOVA was used, followed by post hoc analysis (Dunnett’s multiple comparison tests). Statistical significance was established if p < 0.05 (****p < 0.0001). The statistical analysis was conducted utilizing the GraphPad software. The studies were conducted using a plate reader (POLARstar Omega, BMG).

