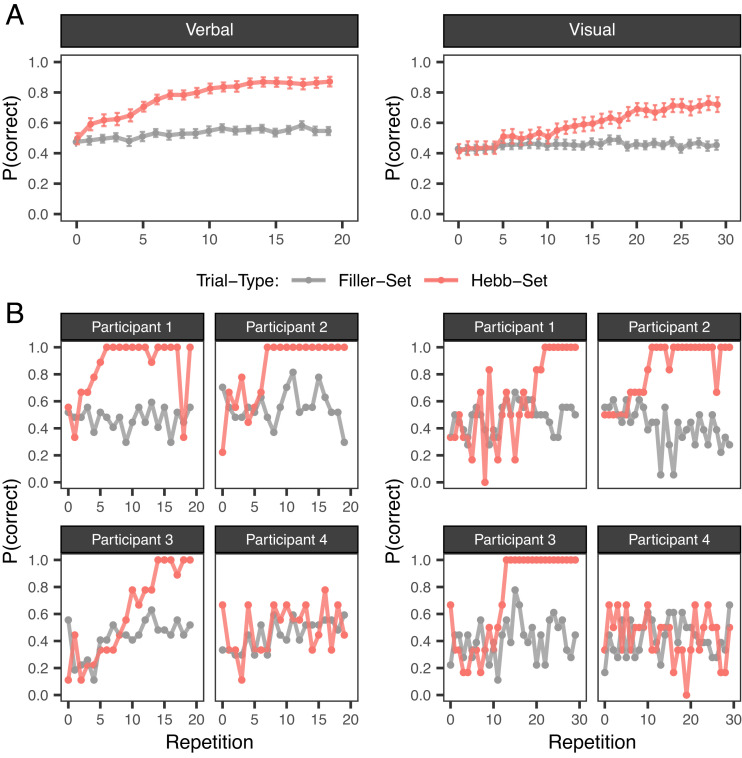
Fig. 1.
(A) Examples of aggregated learning curves typically observed in Hebb repetition experiments. The data are from the “Awareness Rating Condition” of the verbal and visual Hebb experiments conducted in this study. (B) Examples of individual learning curves of four participants each, drawn from the aggregated samples shown on top. Note: P(correct) = proportion of correct responses. The x-axes in panels A and B show the repetition number for the Hebb set. For the filler sets, this corresponds to the average performance in each mini-block.

