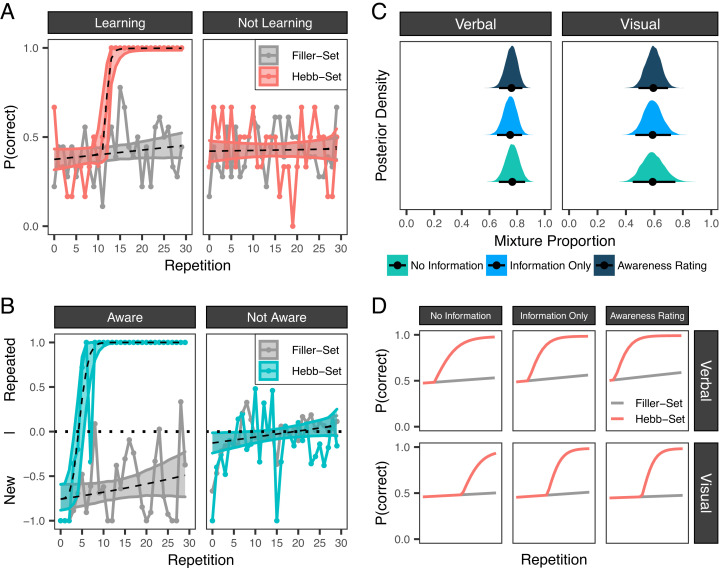
Fig. 3.
Examples of learning (A) and awareness rating (B) data from two participants together with the fit of our model. The example shows the classification of participants into learning/not learning and aware/not aware. The dashed line indicates the predictions of the model with the best-fitting parameters. The colored areas indicate the range of model predictions with parameters sampled from their 95% highest density interval. (C) Estimated mixture proportions from the three experimental conditions in both experiments. The mixture proportion indicates the proportion of participants who were classified as learning. (D) Visualization of the estimated learning curves for the three experimental conditions in both experiments. Learning curves are generated with the medians of the posterior population-level parameters from the fitted model. Note: P(correct) = proportion of correct responses. The x-axes in panels A and B show the repetition number for the Hebb set. For the filler sets, this corresponds to the average performance in each mini-block.

