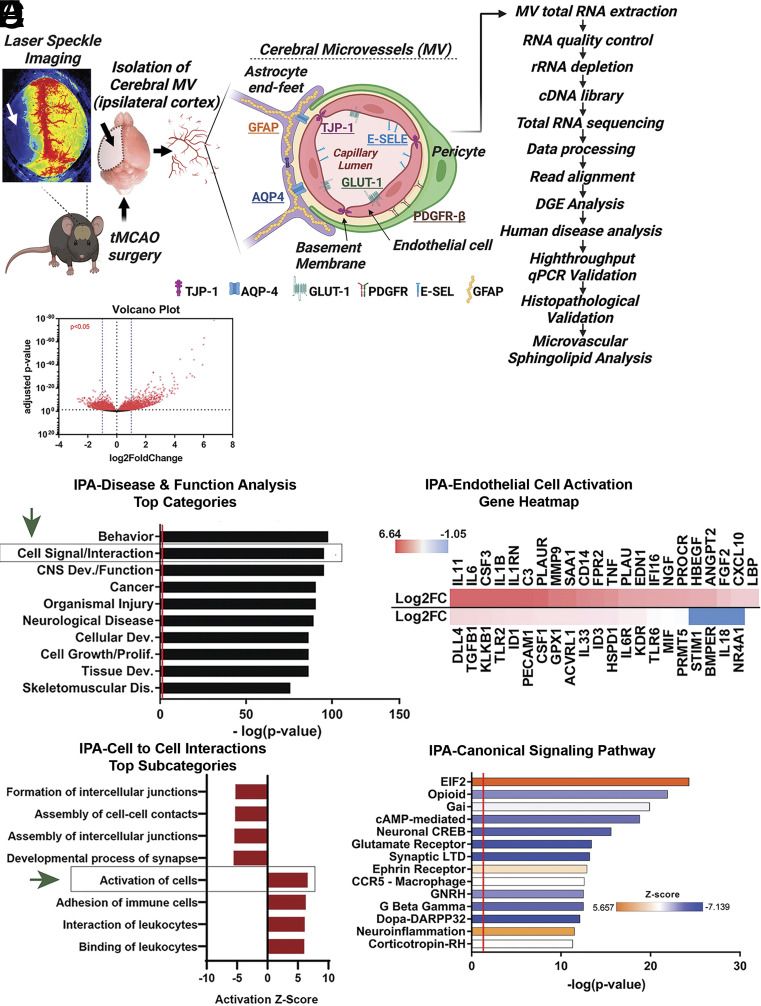
Fig. 1.
Transcriptomic changes in mouse cortical microvessels after tMCAO. (A) Graphical summary of RNA-sequencing workflow and microvessel cell composition. (B) Volcano plot of differential gene expression in microvessels after tMCAO. Red dots represent significantly altered genes (P < 0.05). (C) Bar plot of Disease and Function analysis generated by IPA. (D) Bar plot of the cell-to-cell interaction subcategories which are an expansion of the cell signaling and interaction IPA category in section C (marked by a box and green arrow). (E) Heatmap of the genes involved in the activation of cells IPA subcategory in section D (marked by a box and a green arrow). log2FC are shown. (F) Bar plot of Canonical Signaling Pathway analysis generated by IPA. Additional analysis is shown in Dataset S1. Prediction Z-score is overlaid on the bars with orange representing predicted pathway activation and blue representing predicted inhibition.

