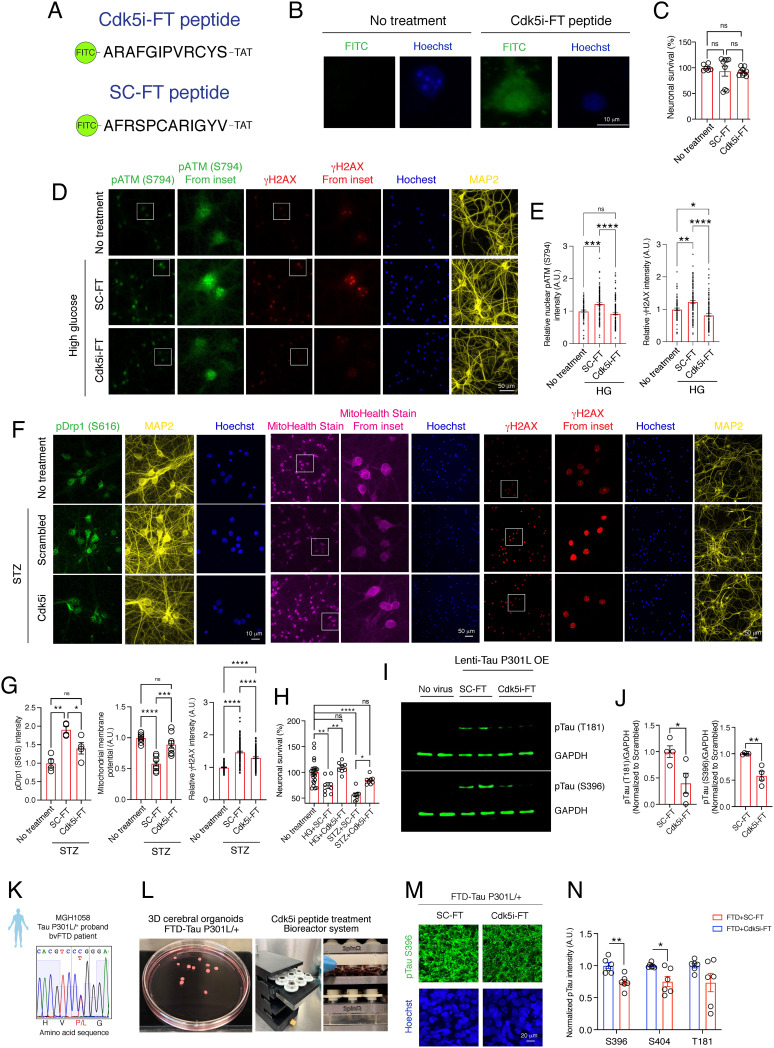
Fig. 2.
Cdk5i-FT peptide treatment counteracts pathological consequences linked to Cdk5 hyperactivity in cultured neurons and in models of tauopathy. (A) For cellular assays, Cdk5i and scrambled peptides were conjugating to FITC at the N-terminus and the TAT-sequence at the C-terminus. (B) Representative images of peptide penetration (FITC signal: green; Hoechst: blue) into 14 DIV cultured neurons after Cdk5i-FT peptide treatment. (C) Bar graphs represent the viability of cultured neurons (at least six replicates) after 6-h peptide treatment (10 nM). (D) Representative images of high-glucose challenged cultured neurons stained for pATM S794 (green), γH2AX (red), MAP2 (yellow), and Hoechst (blue). (E) Bar graph represents the intensity of pATM S794 and γH2AX (at least 76 nuclei were analyzed from two coverslips). (F) Representative images of STZ-challenged cultured neurons stained for pDrp1 S616 (green), MitoHealth dye (magenta), γH2AX (red), and Hoechst (blue). (G) Bar graphs represent the intensity of pDrp1 S616 (four replicates from two coverslips per group), MitoHealth stain (eight replicates from four coverslips, two experiments), and γH2AX (107 to 154 nuclei were analyzed from two coverslips). (H) Viability assay of cultured neurons was performed 24 h after high glucose or STZ insults; at least eight replicates in each group. (I) Representative blot images of pTau T181, pTau S396, and GAPDH. (J) Bar graphs represent the relative immunoreactivity for pTau normalized to the SC-FT-treated group. Four replicates from three independent experiments. (K) Sanger sequencing confirms that the FTD patient iPSC line carrying a heterozygous Tau P301L mutation. (L) Pictures of cerebral organoids and 3D-printed bioreactor system. (M) Representative images of 4-month-old cerebral organoids stained for pTau (S396) (green) and Hoechst (blue). (N) Bar graph represents the immunoreactivity for pTau normalized to SC-FT treatment. At least three organoids and two sections per organoid were analyzed in each group.

