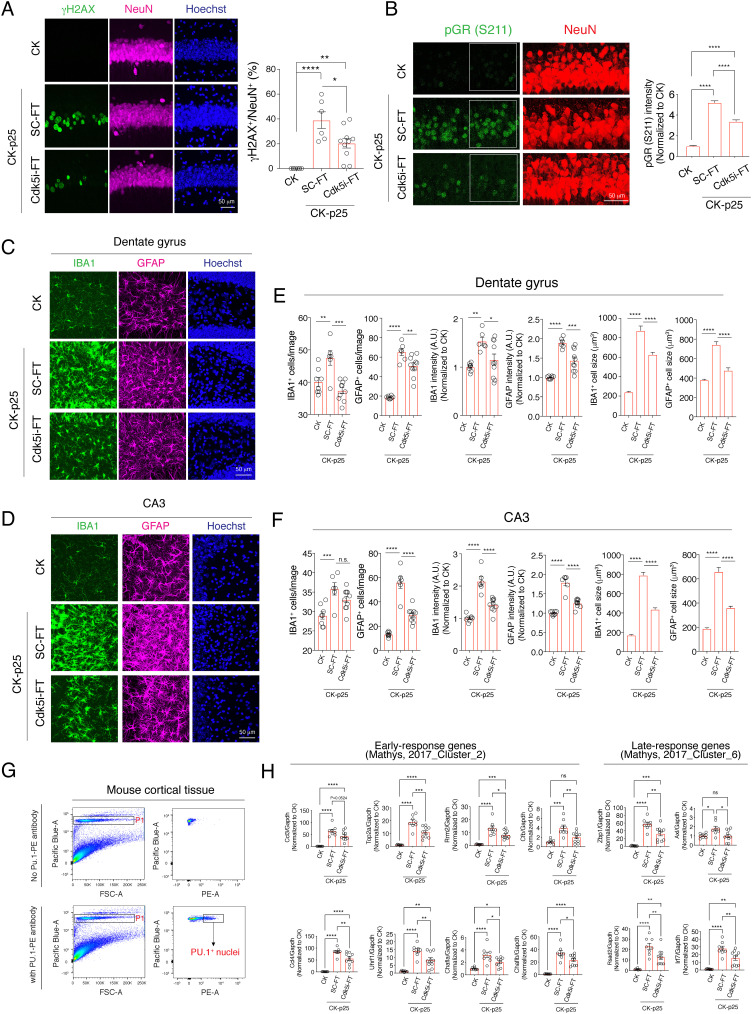
Fig. 3.
Cdk5i-FT peptide treatment prevents pathological phenotypes in CK-p25 mice brain. (A) Representative image of hippocampal CA1 region of CK and peptide-treated CK-p25 mice stained for γH2AX (green), NeuN (magenta), and Hoechst (blue). Bar graph represents the percentage of γH2AX-positive neurons in each image. Mice analyzed in each group: 4, 3, 5; two sections/mouse. (B) Representative image of hippocampal CA1 region of CK and peptide-treated CK-p25 mice stained for pGR S211 (green), NeuN (red), and Hoechst (blue). Mice analyzed in each group: 4, 3, 5; two sections/mouse. NeuN-positive nuclei were used to analyze pGR intensity. Nuclei analyzed in each group: 190, 241, 289. (C and D) Representative image of hippocampal dentate gyrus (C) and CA3 region (D) of CK and peptide-treated CK-p25 mice stained for IBA1 (green), GFAP (magenta), and Hoechst (blue). (E and F) Bar graphs represent the number of microglia/astrocytes, the intensity of IBA1/GFAP, and the cell volume of microglia/astrocytes. Mice analyzed in each group: 4, 3, 5; two sections/mouse. (G) Gating strategy for the isolation of PU.1+ microglia from mouse cortical tissue. (H) RT-qPCR analysis indicates the expression of early and late-response genes in microglia purified from CK or CK-p25 mice after peptide treatment. Mice analyzed in each group: 8, 8, 10.

