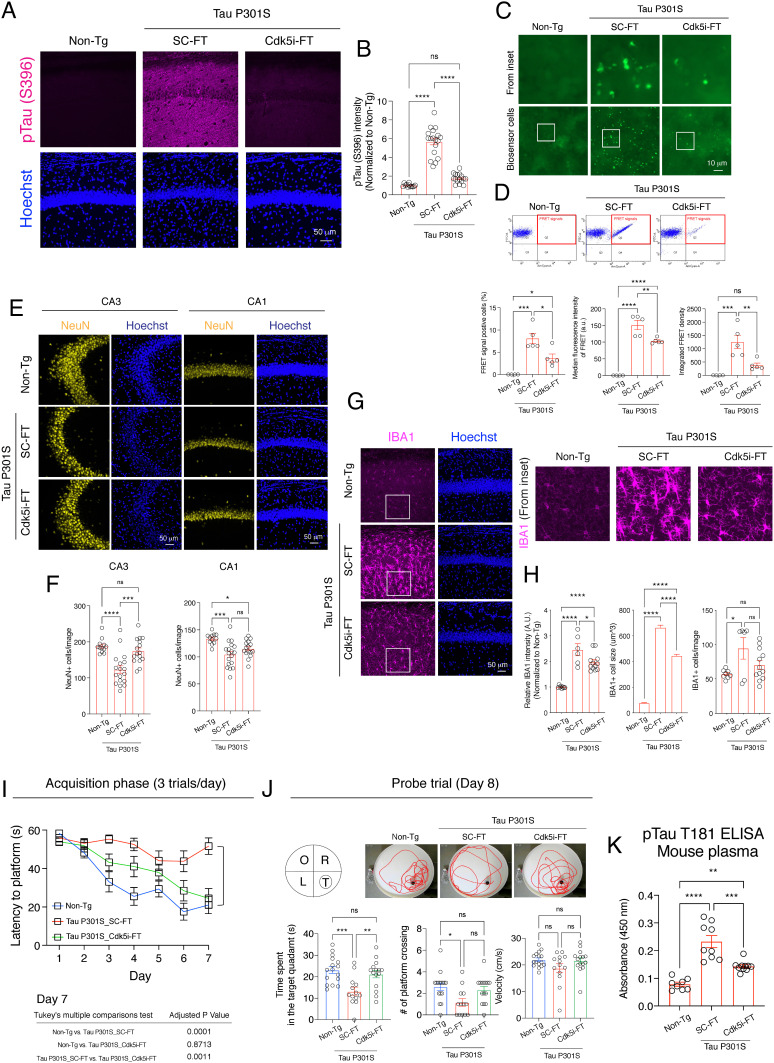
Fig. 4.
Cdk5i-FT peptide ameliorates Tau-mediated neurodegenerative phenotypes in 7- to 9-month-old Tau P301S mice. (A) Representative image of hippocampal CA1 region of non-Tg and peptide-treated Tau P301S mice stained for pTau S396 (magenta) and Hoechst (blue). Bar graphs represent the intensity of pTau S396 in each image. Mice analyzed in each group: 6, 9, 8; two sections/mouse. (B) Representative image of Tau biosensor cells 48 h posttransduction with the brain lysates prepared from non-Tg controls and from Tau P301S mice treated with Cdk5i or scrambled. (C) Flow cytometry was used to measure FRET signals in each sample. Cells in quadrant (Q) 2 are FRET-positive cells. (D) Bar graphs represent the percentage of FRET-positive cells, median fluorescence intensity of FRET-positive cells, and integrated FRET density. Mice analyzed in each group: 4, 5, 5. (E) Representative image of hippocampal CA3 and CA1 region of non-Tg and peptide-treated Tau P301S mice stained for NeuN (yellow) and Hoechst (blue). (F) Bar graphs represent the number of NeuN-positive cells in each image. Mice analyzed in each group: 6, 9, 8; two sections/mouse. (G) Representative image of hippocampal CA1 region of non-Tg and peptide-treated Tau P301S mice stained for IBA (magenta) and Hoechst (blue). (H) Bar graphs represent the intensity of IBA1, the cell volume of microglia, and the number of microglia in each image. Mice analyzed in each group: 6, 9, 8; two sections/mouse. (I) Plot shows the latencies to hidden platform during the acquisition phase of the MWM test. (J) Bar graphs represent time spent in each Q, # of platform crossing, and swim velocity during the probe trial. Images show the location of each Q and swim trace of mouse during the probe trial. T = target, O = opposite, R = right, L = left. Animals analyzed were 16, 13, 15. (K) Bar graph represents plasma levels of pTau T181 in each group. Animals analyzed were 8, 9, 10.

