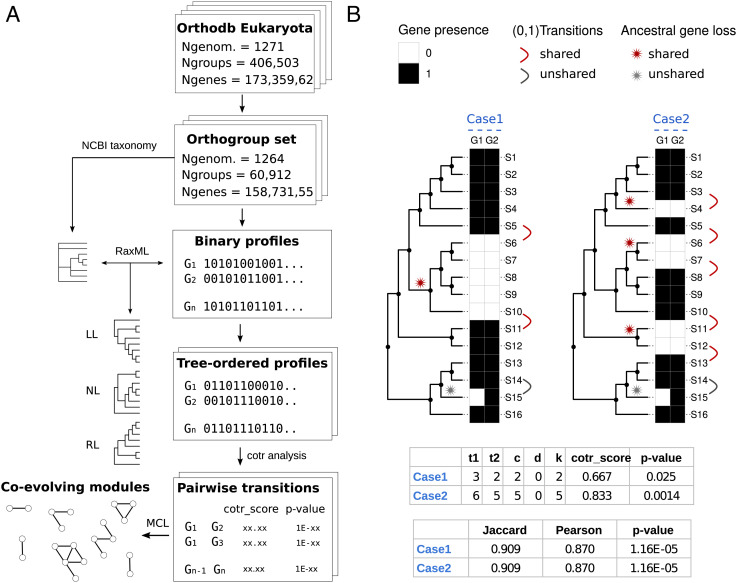
Fig. 1.
Pipeline and metrics for coevolutionary analysis. (A) Scheme of the workflow used for coevolutionary analysis. (B) Scheme illustrating the metrics used for measuring score and significance of coevolutionary associations. Two evolutionary scenarios (Case 1 and Case 2) with 16 species (S1 to S16) related by a phylogenetic tree and two orthogroups (G1, G2) with the same correspondence (15 matches, 1 mismatch) of presence (black squares) and absence (white squares) states are compared. For the two cases, reported are the score and significance computed from the enumeration of state transitions (1→0, 0→1) along the phylogenetic profile vectors. The cotr_score is a function of the total state transitions (t1, t2) and the number of concordant (c) and discordant (d) transitions (k = c − d; see also SI Appendix, Fig. S1). Unshared transitions (gray) are counted in the total number of transitions (t1 or t2), but they are considered neither concordant or discordant. Significance (P-value) is calculated from the transition table using Fisher’s exact test (Methods). Standard measures of profile similarities (Jaccard, Pearson) and Pearson P-values are reported for comparison. Although the associations between G1 and G2 receive the same scores and significance by global measures of similarity, the cotr_score is more significant in Case 2, consistent with the higher occurrence of shared gene losses, and the higher confidence of functional association.

