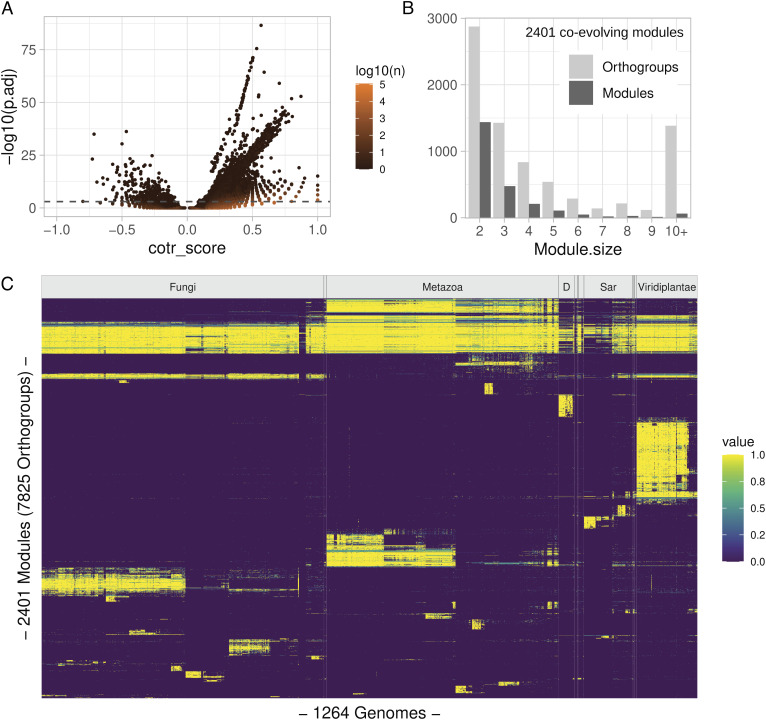
Fig. 2.
General results of the coevolutionary analysis. (A) Volcano plot showing the relation between score (cotr_score) and significance (adjusted P-values; P. adj) of 4,727,281 orthogroup pairs with unadjusted P-value <10−3; the numerosity of individual dots is indicated by the dot color as shown in the scale bar. The dashed gray line represents the p.adj cutoff (1e-3) used in subsequent analyses; transitions were calculated using an RL tree. (B) Size distribution of 2,401 coevolving modules obtained by applying the Markov cluster (MCL) algorithm to individual orthogroup pairs; 22,865 pairs with positive cotr_score and significant p.adj value in all fully resolved tree orientations were considered. (C) Organism distribution of coevolving modules. Colors indicate the fraction of orthogroups belonging to the same module present in individual genomes as shown in the scale bar. Vertical lines indicate the boundaries of taxonomic groups at the kingdom level. D=Discoba; groups with <20 members are unlabeled. Species are ordered according to an RL tree polarized with Viridiplantae as the starting node. Modules are ordered according to their Canberra distance in species distribution.

