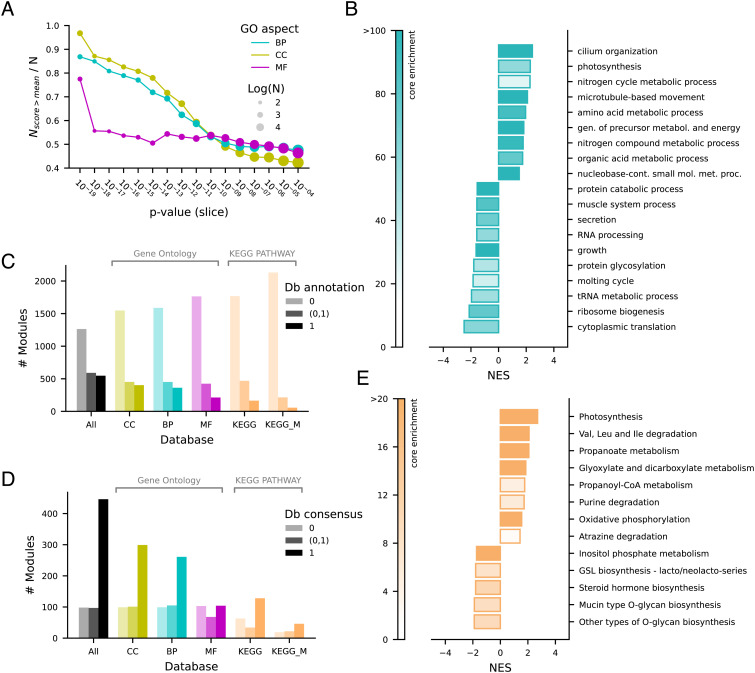
Fig. 3.
Functional relationships of coevolving orthogroups. (A) Similarity of gene ontology (GO) experimental annotation in orthogroup pairs binned by unadjusted P-values. The fraction of orthogroup pairs with semantic similarity scores above the mean is reported for the GO aspects cellular component (CC), biological process (BP), and molecular function (MF). (B) Enrichment bar-plot of GO BP using an enrichment P-value cutoff of 0.001; NES = normalized enrichment score. (C) Module experimental annotation (fraction of orthogroups) in GO, KEGG, and KEGG metabolism (KEGG_M) databases. (D) Consensus of database annotation in modules. The database annotation consensus (Db consensus) indicates the fraction of annotated orthogroups included in the same GO-Slim term or KEGG map. (E) Enrichment bar-plot of KEGG metabolism using an enrichment P-value cutoff of 0.01; NES = normalized enrichment score.

