Fig. 6.
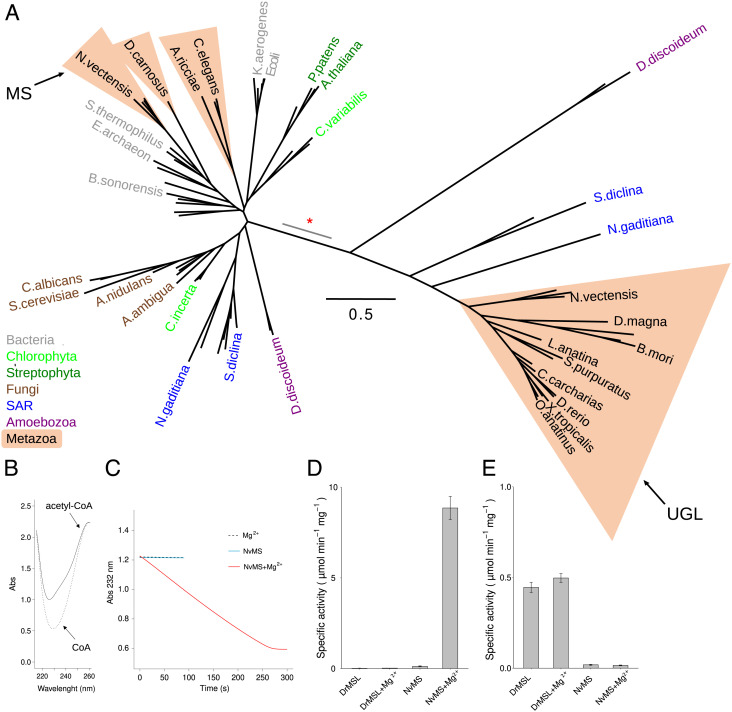
Evolutionary and functional divergence of malate synthase and ureidoglycolate lyase. (A) Unrooted maximum likelihood tree of MS and UGL sequences constructed using PhyML with the LG model (49). The scale bar corresponds to the number of calculated substitutions per site (0.5). Selected terminal nodes are labeled with the abbreviated species name; metazoan species are included in salmon triangles and other species are colored according to taxonomy. Proteins characterized in this work as malate synthase (MS) and ureidoglycolate lyase (UGL) are indicated by arrows. The branch of the inferred gene duplication separating MS and UGL is indicated by a red asterisk; the gray segment indicates uncertainty in the node position along the branch. (B) Superimposed spectra of acetyl-CoA (0.25 mM, solid line) and CoA (0.25 mM, dotted line). (C) Kinetics of the condensation of acetyl-CoA (0.25 mM) and glyoxylate (0.50 mM) catalyzed by NvMS, monitored at 232 nm. The assay was performed in the presence of 1 mM MgCl2 (dashed line), or 0.125 µM NvMS (light blue line), or both MgCl2 and NvMS (red line). (D) Malate synthase-specific activity of DrMSL and NvMS in the presence or in the absence of 1 mM MgCl2. (E) Ureidoglycolate lyase-specific activity of DrMSL and NvMS in the presence or in the absence of 1mM MgCl2.

