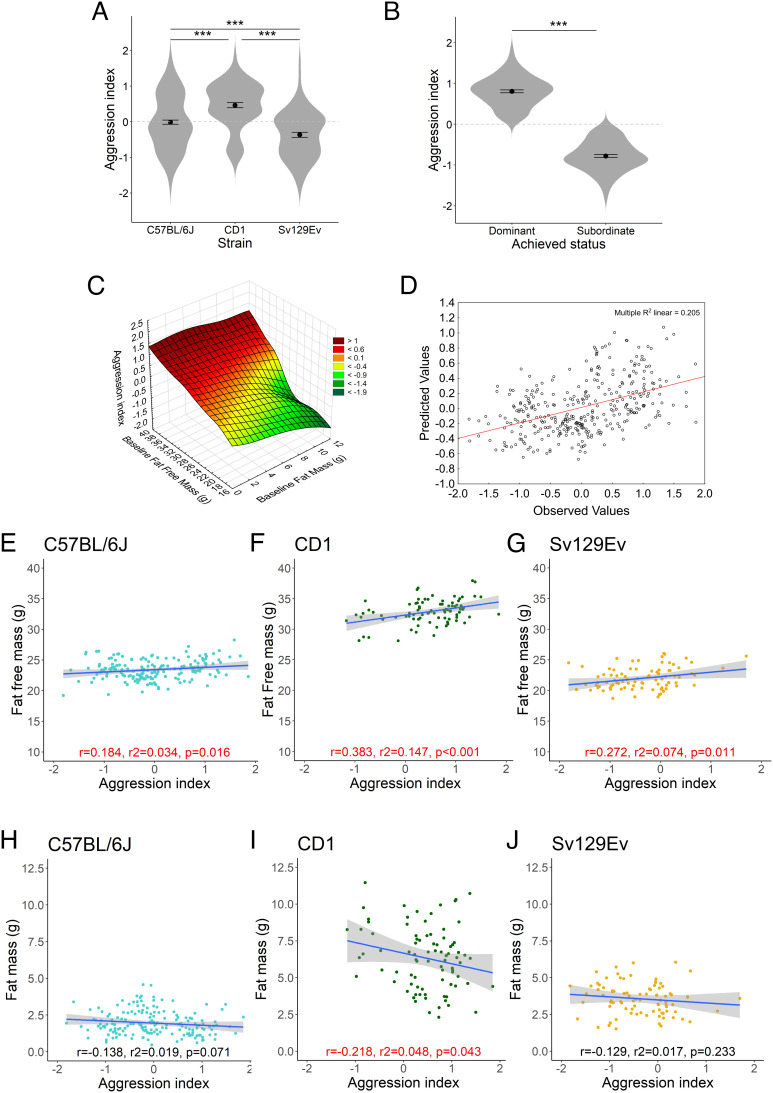
Fig. 2.
Aggression index characterization. (A) Strains differed considerably for the level of aggression index with CD1 exhibiting higher levels than C57BL/6J and Sv129Ev; Sv129Ev expressed the lowest level [F(2,342) = 29.221, P < 0.001, = 0.105, obs. power = 0.999]. (B) Achieved social status was associated with significantly different aggression index values where dominant mouse had a significantly higher aggression index than subordinate mouse [F(1,231) = 1073, P < 0.001, = 0.072, obs. power = 0.997]. (C) 3D scatter plot of aggression index in relationship to initial values of fat and fat-free mass exhibited by mice. (D) Multiple regression scatterplot of observed and predicted aggression index values based on fat and fat-free mass predictors. (E–G) Scatterplot of the correlation between fat-free mass and aggression index in each strain. (H–J) Scatterplots of the correlation between fat mass and aggression index in each strain. Data represent group mean ± SEM in A and B. Asterisks represent significant differences from ANOVA with pairwise comparisons tested with Tukey’s honestly significant difference (HSD). In figures E through n, P < 0.05 are noted in red.

