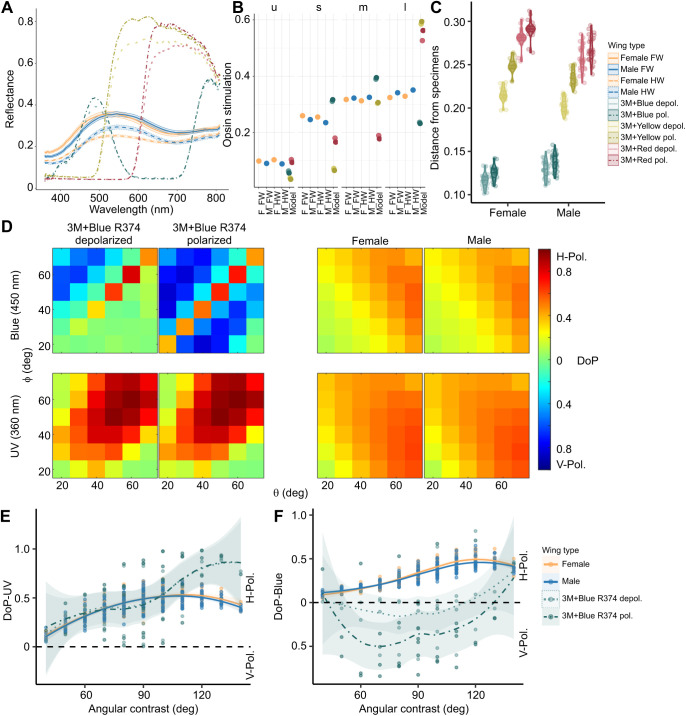
Fig. 6.
Spectral and polarization properties of butterfly wing models and specimens. (A) Spectral reflectance properties of constructed butterfly wing models (dot-dash lines without confidence bands) employed in the behavioral experiment, with the spectra of the pinned butterfly specimens (lines with confidence bands) overlaid for comparison. Error bands on specimen spectra represent the s.e.m. (B) Dot-plot showing the relative stimulation values of the wing models and the mean stimulation values of the J. evagoras specimens (F, female; M, male; FW, forewing; HW, hindwing) for the four rhodopsins: ‘u’ for UV, ‘s’ for ‘short wavelength’ (blue), ‘m’ for ‘medium wavelength’ (green) and ‘l’ for ‘long wavelength’ (red) (see Materials and Methods). (C) Violin plot of unweighted Euclidean distances in tetrahedral color space between the reflectance spectra of pinned male and female butterfly specimens from Fig. 5 and polarized and depolarized wing models. Lower Euclidean distances indicate more similar colors. (D) Heatmaps of horizontal (H) or vertical (V) DoP of 3M+Blue R374 polarized and depolarized wing models and biological specimens under both blue (450 nm) and UV (360 nm) light across a range of detection (ɸ) and incident (θ) light angles. (E) Horizontal or vertical DoP of 3M+Blue R374 wing models as a function of total angular contrast (detection angle+incident light angle) under UV (360 nm) light. (F) Horizontal or vertical DoP of 3M+Blue R374 wing models as a function of total angular contrast under blue (450 nm) light. Male and female specimen DoP traces are included in E and F as a reference. As in Fig. 5, solid lines denote forewings, and dashed lines denote hindwings. Polarized wing model traces are denoted by dot-dash lines and ‘depolarized’ wing model traces are denoted by dotted lines. In E and F, the smoothed means with loess confidence ribbons are plotted for illustration purposes.

