Fig. 7.
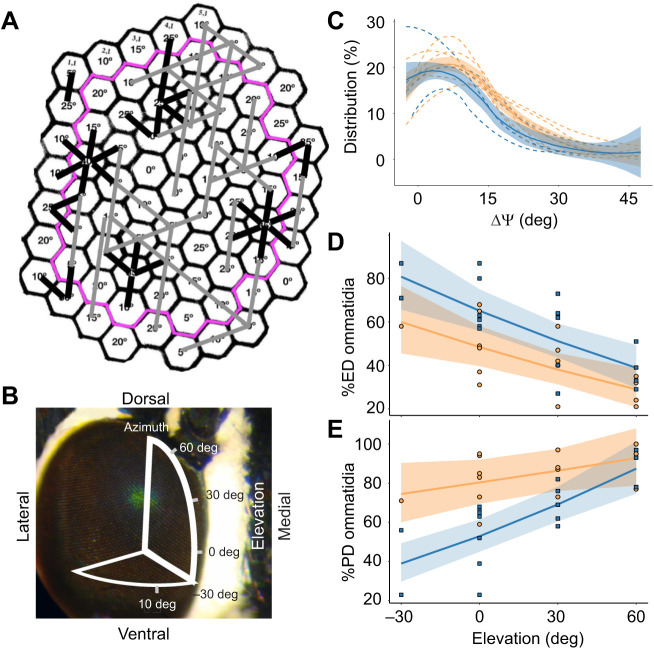
Conservative theoretical exercise to explore the design of edge detector and polarization detector subarrays. (A) Ommatidial array of Fig. 3 annotated with principal axes Σ. Our conservative theoretical exercise defines edge detectors as rows of three or more ommatidia along which Σ deviates no more than ±5 deg (marked here with straight gray bars), and defines robust polarization detectors as misaligned adjacent pairs of ommatidia for which ΔΣ is at least 20 deg (marked with short black bars). The pink outline encloses all ommatidia that have six measured nearest neighbors (N=48 interior ommatidia), from which final values were calculated. (B) Jalmenus evagoras compound eye, overlaid with a diagram showing the elevational angles sampled across the eye. (C) Microvillar principal axes Σ are heterogeneous across all sampled elevational patches, and most ommatidia are misaligned at least 10 deg with respect to their nearest neighbors. The distribution of ΔΣ between neighboring ommatidia of patches at 0 deg elevation is plotted as separate, smoothed, dashed lines for each individual, while the solid lines with standard error bands show the average distribution and standard error of ΔΣ for males and females collectively. At other elevations, ΔΣ distributions are shifted towards larger angles. Smoothed lines were calculated using locally weighted regression as employed by the loess method in the geom_smooth function of the ggplot2 package. (D) The percentage of ommatidia that are suitable for edge detection (ED) declines significantly with increasing elevation in the eye (T=23.056, P=0.0001). Males show a significantly higher overall percentage of such ommatidia at all elevations (T=6.882, P=0.0183). (E) The percentage of adjacent pairs of ommatidia that are suitable for robust polarization detection (PD) increases significantly with increasing elevation in the eye (T=19.885, P=0.0001). Overall, females exhibited a significantly larger percentage of PD ommatidia than males (T=7.977, P=0.012). In C–E, males are plotted in blue and females are plotted in orange. In D and E, the smoothed conditional means are plotted for the interaction effect of sex and elevation from our mixed-effects linear model analysis, with 95% confidence bands plotted for illustration purposes, calculated using the Kenward–Rogers approximation for fixed-effect standard error (Fox, 2003).

