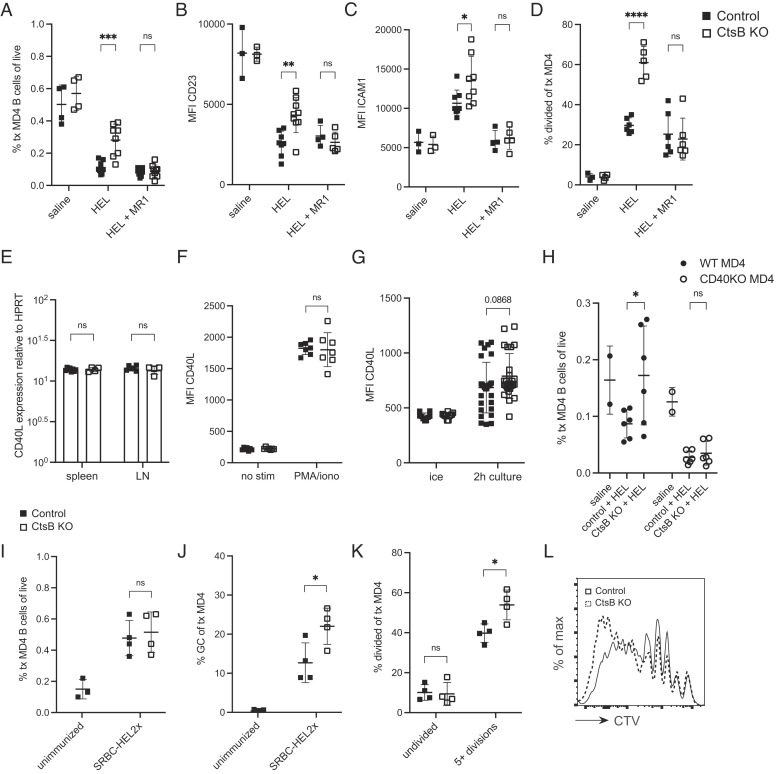
Fig. 4.
Enhanced HEL-Binding B Cell Persistence in Ctsb-deficient Hosts Depends on CD40L and CD40. (A) Frequencies of transferred MD4 B cells in spleens of control or Ctsb-deficient recipients 3 d after saline, HEL, or HEL with MR1 CD40L-blocking treatment. (B and C) MFI of CD23 (B) and ICAM1 (C) on transferred MD4 B cells 1.5 d after saline (n = 4 control, n = 4 KO), HEL (n = 8 control, n = 8 KO), or HEL with MR1 treatment (n = 9 control, n = 9 KO). (D) Percentage of divided transferred MD4 B cells 3 d after saline (n = 3 control, n = 4 KO), HEL (n = 6 control, n = 5 KO), or HEL with MR1 treatment (n = 6 control, n = 6 KO). (E) CD40L transcript abundance in naïve CD4+ T cells isolated from spleen and lymph node tissues harvested from control (n = 6) or Ctsb−/− (n = 3) mice. CD40L and hypoxanthine phosphoribosyltransferase (HPRT) transcripts were quantitated by real-time PCR. Data show results from two separate experiments. (F) MFI of CD40L on purified CD4+ T cells from control (n = 7) or Ctsb-deficient (n = 8) mice incubated without (no stim) or with (PMA/iono) PMA and ionomycin for 2 h at 37 °C. (G) MFI of CD40L on purified CD4+ T cells from control (n = 27) or Ctsb-deficient (n = 26) mice kept on ice or incubated in a dilute culture for 2 h at 37 °C. (H) Frequencies of WT or CD40-deficient MD4 B cells in transferred splenocytes in spleens of control or Ctsb-deficient recipients 3 d after saline (n = 2 control, n = 2 KO) or HEL treatment (n = 6 control, n = 6 KO). (I and J) Frequencies of transferred MD4 B cells amongst total cells (I) and of MD4 B cells having a germinal center (GC) phenotype (J) in spleens of unimmunized mice (n = 3) or mice immunized with SRBC-HEL2x (n = 4 control, n = 4 KO). (K) Frequencies of undivided MD4 B cells or MD4 B cells having undergone five or more divisions in spleens of control (n = 4) or Ctsb-deficient mice (n = 4) 5 d after SRBC-HEL2x immunization. (L) Representative histogram plot of CTV labeling of transferred MD4 B cells in indicated recipients 5 d after SRBC-HEL2x immunization. Each data point indicates an individual mouse and lines indicate means. Error bars represent SDs. A–D and H are representative of three experiments. I–L are representative of two experiments. Statistical significance for A–K was determined by unpaired t test. NS, not significant; *P < 0.05; **P < 0.01; ***P < 0.001; ****P < 0.0001.

