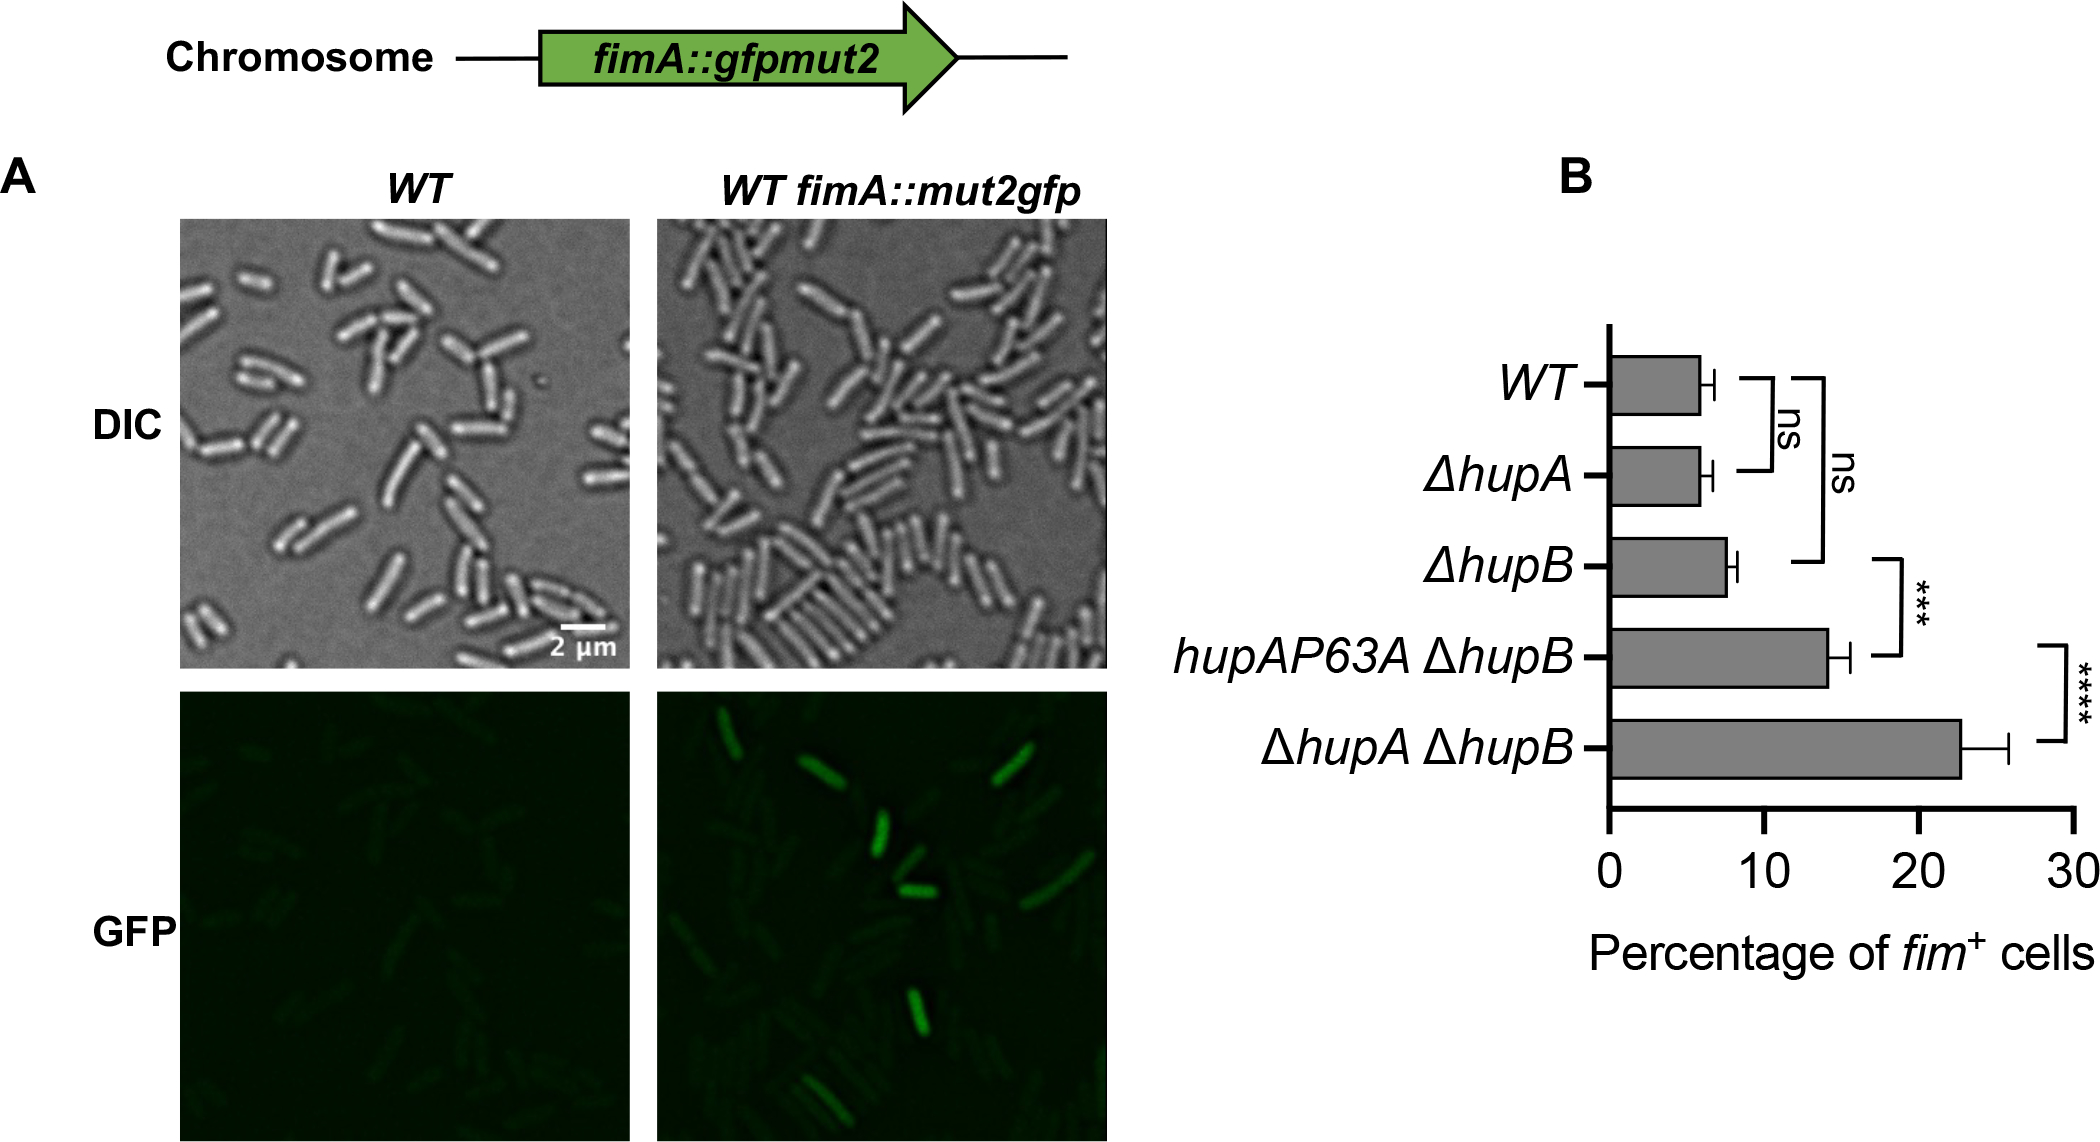
Fig. 6.

Role of HU in transcription regulation of type 1 fimbriae genes
(A) Representative fluorescence and differential interference contrast images of WT cells, or WT cells harboring fimA::gfpmut2 transcriptional reporter.
(B) Percentage of cells expressing GFP fluorescence above background in E. coli strains harboring the indicated deletion mutations in hupA and hupB genes and mutations in the hupA gene to introduce P63A amino acid substitution in the HUα subunit. Graphical and error bars represent averages and standard deviation of at least four fluorescence images each containing more than 200 cells. Experiment was performed twice, with similar results. Statistically significant differences as determined by 1-way ANOVA with Dunnett’s multiple comparisons test. ns not significant; *** adjusted p-value 0.0001; **** adjusted p-value <0.0001.
