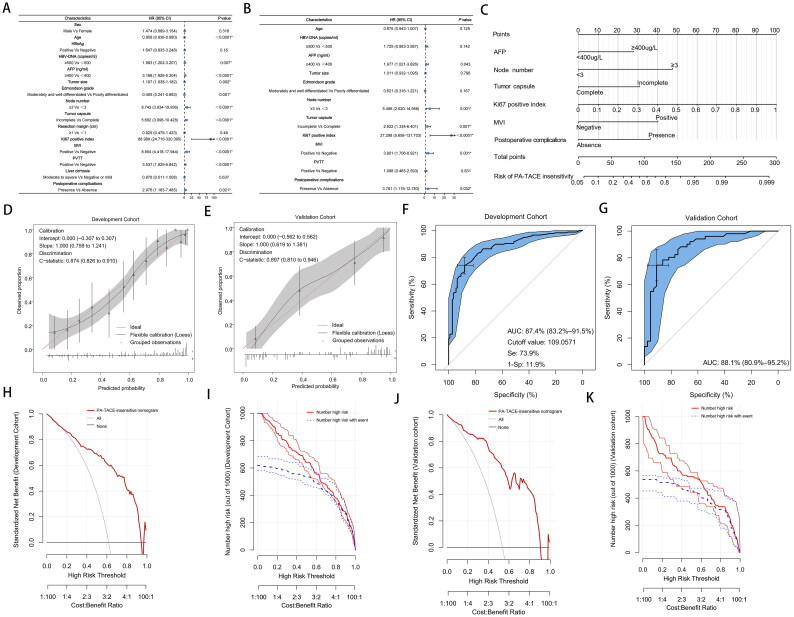
Figure 2.
(A) Univariable and (B) multivariable analyses of associations in PA-TACE-insensitive of hepatocellular carcinoma. (C) Postoperative nomogram for predicting the PA-TACE-insensitive of hepatocellular carcinoma. Calibration curve for predicting PA-TACE-insensitive in the (D) development cohort and (E) validation cohort. Receiver operating characteristic curve of the postoperative nomogram in (F) the development cohort and (G) the validation cohort. AUC, Area under the curve. The cutoff value was determined by ROC curve. DCA of the PA-TACE- insensitive nomogram in (H) the development cohort and (I) the validation cohort. The X axis shows the high-risk threshold, and the Y axis represents the standardized net benefit. Clinical impact curves of the PA-TACE-insensitive nomogram in (J) the development cohort and (K) the validation cohort. The number of high-risk patients (blue dotted line) and the number of high-risk patients with events (red solid line) are plotted.

