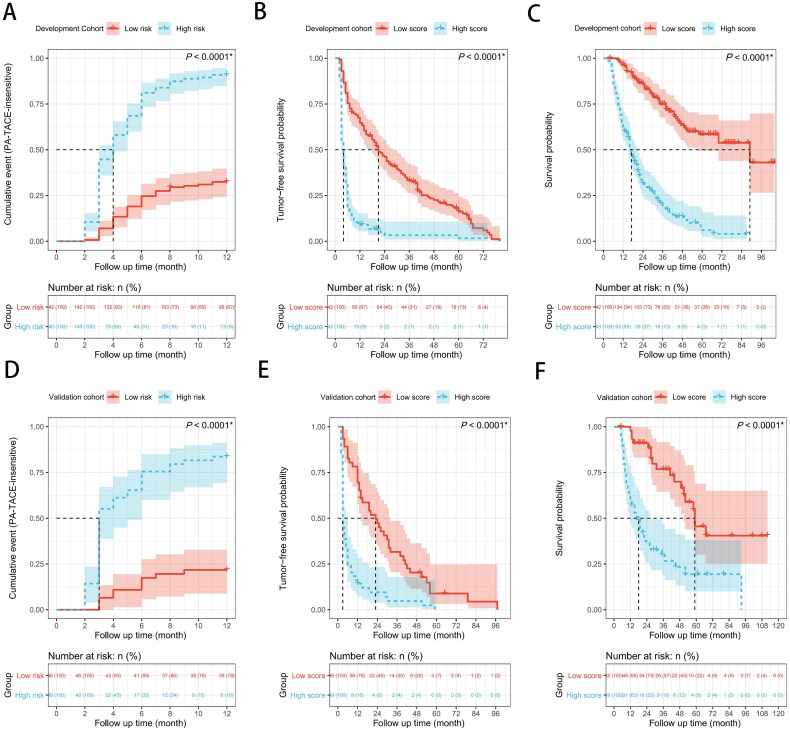
Figure 3.
(A) Possibility of PA-TACE-insensitive, (B) recurrence-free survival (RFS), and (C) overall survival (OS) between the low score group and the high score group in the development cohort. (D) Possibility of PA-TACE-insensitive, (E) recurrence-free survival (RFS), and (F) overall survival (OS) between the low score group and the high score group in the validation cohort. The log-rank test was used to determine significant differences between Kaplan–Meier curves.

