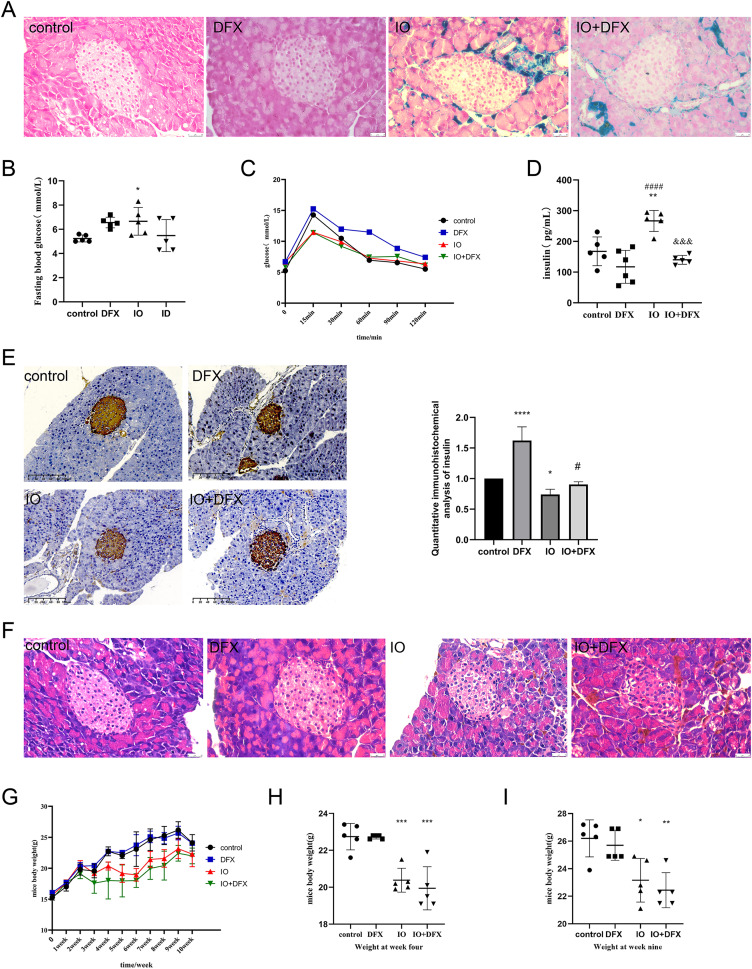
Figure 1. Effects of iron overload on islet production in mice.
(A) Prussian blue staining of mouse pancreatic tissue, and the blue color indicated ferritin deposition. Scale bar: 25 μm; (B) fasting blood glucose of mice, *P < 0.05 vs. the control group; (C) OGTT in mice; (D) fasting insulin levels: **P < 0.01 vs. the control group, ####P < 0.0001 vs. the DFX group, &&&P < 0.001 vs. the IO group; (E) insulin immunohistochemical staining of mouse pancreatic tissue, brown color indicates positive expression area, scale scale: 100 μm. The mean optical density values of the positive areas were calculated by image J software to evaluate insulin expression, it is shown by the bar chart. *P < 0.05, ****P < 0.0001 vs. the control group, #P < 0.05 vs. the IO group; (F) HE staining of mouse pancreas, scale bar: 25 μm; (G, H, I) body weight of mice, *P < 0.05, **P < 0.01, ***P < 0.001 vs. the control group.

