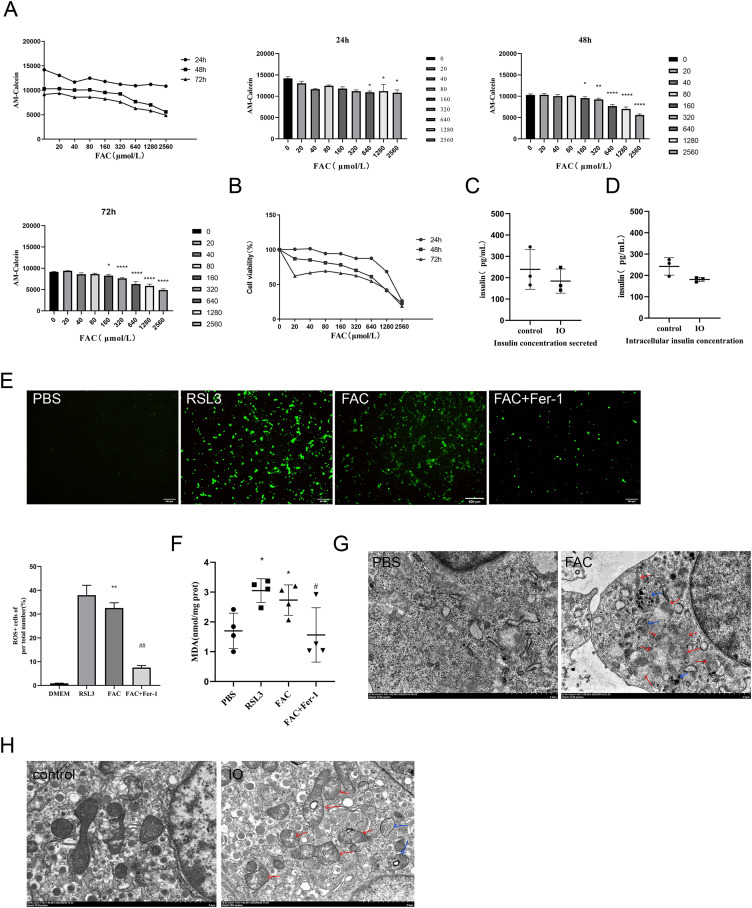
Figure 2. Ferroptosis of islet β cells due to iron overload.
(A) Intracellular LIP levels in MIN6 cells, OD values were inversely proportional to LIP levels, as detailed in the Methods and Materials section. The LIP levels of each treatment concentration at 24 h, 48 h and 72 h were statistically analyzed, *P < 0.05, **P < 0.01, ****P < 0.0001 vs. the control group; (B) viability of MIN6 cells; (C and D) glucose-stimulated insulin secretion test in MIN6 cells; (E) ROS level in MIN6 cells, and green fluorescence showed positive cells. The proportion of positive cells was calculated and statistically analyzed by image J software, and the bar graph shows the quantification of positive cells. **P < 0.01 vs. the control group, ##P < 0.01 vs. the FAC group; (F) MDA level in MIN6 cells; *P < 0.05 vs. the control group, #P < 0.05 vs. the FAC group; (G) the ultrastructure of MIN6 cells under the transmission electron microscope, blue arrows are autophagosomes, red arrows are shrunken mitochondria, and crista within mitochondria are reduced. Scale bar: 2 μm; (H) mouse islet β cells under the transmission electron microscope, blue arrows are autophagosomes, red arrows are mitochondria with significantly reduced cristae, and mitochondrial cristae within mitochondria is reduced. Scale bar: 2 μm.

