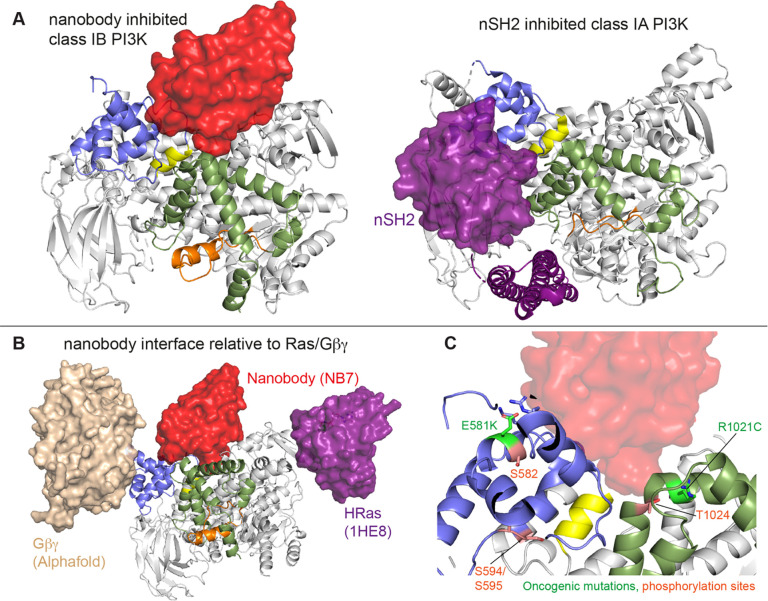
Figure 6. Comparison of nanobody binding site compared to p85 inhibition of class IA PI3Ks and class IB activation sites.
A. Comparison of the nanobody NB7 binding site in p110γ compared to the nSH2 inhibitory site in p110α (PDB: 3HHM) (Mandelker et al., 2009)
B. Comparison of the nanobody NB7 binding site in p110γ compared to the X-ray structure of the Ras binding site (PDB: 1HE8) (Pacold et al., 2000) and the Alphafold model of Gβγ bound to p110γ (Rathinaswamy et al., 2023).
C. Oncogenic mutations and post-translational modifications in spatial proximity to the nanobody binding site.

