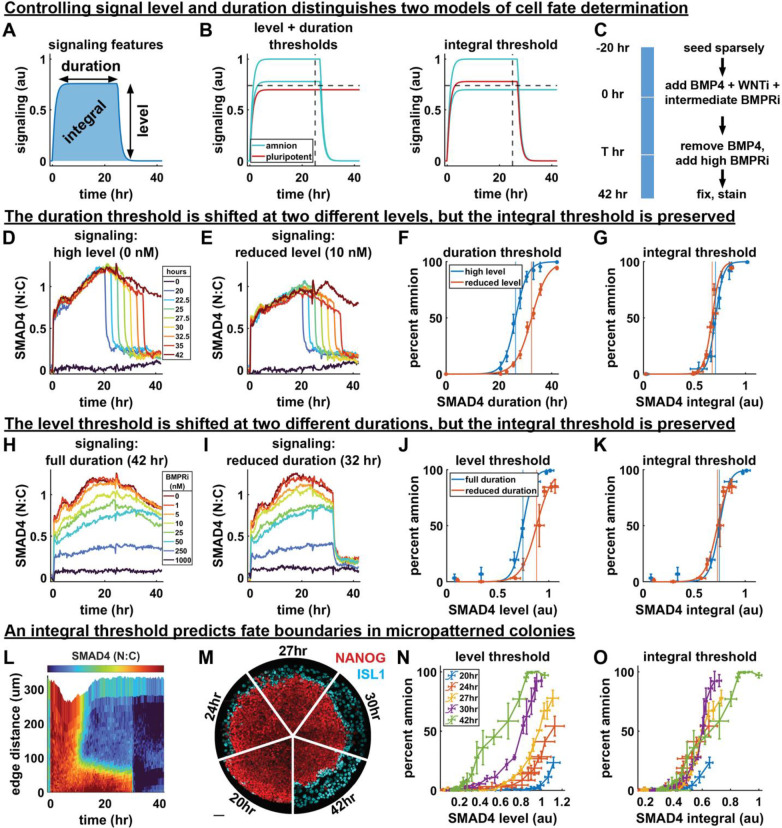
Figure 4: The time-integral of BMP signaling controls differentiation.
(A) Diagram of relevant signaling history features. (B) Hypothetical set of signaling histories for which a combined level and duration threshold model makes a different prediction of cell fate than an integral threshold model. (C) Schematic of the experimental procedure used to control the level and duration of signaling. (D) Mean signaling for different durations without initial BMPRi. (E) Mean signaling for different duration with an initial BMPRi treatment of 10nM, legend in 4D. (F) Duration thresholds based on logistic sigmoid fit for two signaling levels, error bars are standard deviation over technical replicates. Thresholds in any signaling feature are defined by 50% differentiation. (G) Integral thresholds for the same data as (F). (H) Mean signaling for 8 doses of BMP inhibition with LDN193189. (I) Mean signaling for different initial levels of BMPRi with a 32-hour duration. (J) Level threshold for both signaling durations. Error bars are standard deviation over technical replicates (K) Integral thresholds for data from (J). (L) Kymograph of average BMP signaling for colonies treated with BMP inhibitor at 30 hours. (M) IF data showing amnion differentiation for each signaling duration (scale bar 50um) (N) Percent differentiation against mean signaling level before shutdown for each duration. Each point represents a radial bin (a fixed distance from the colony edge). Error bars are standard deviation colonies per condition. (O) Percent differentiation against signaling integral. Error bars as in (N).

