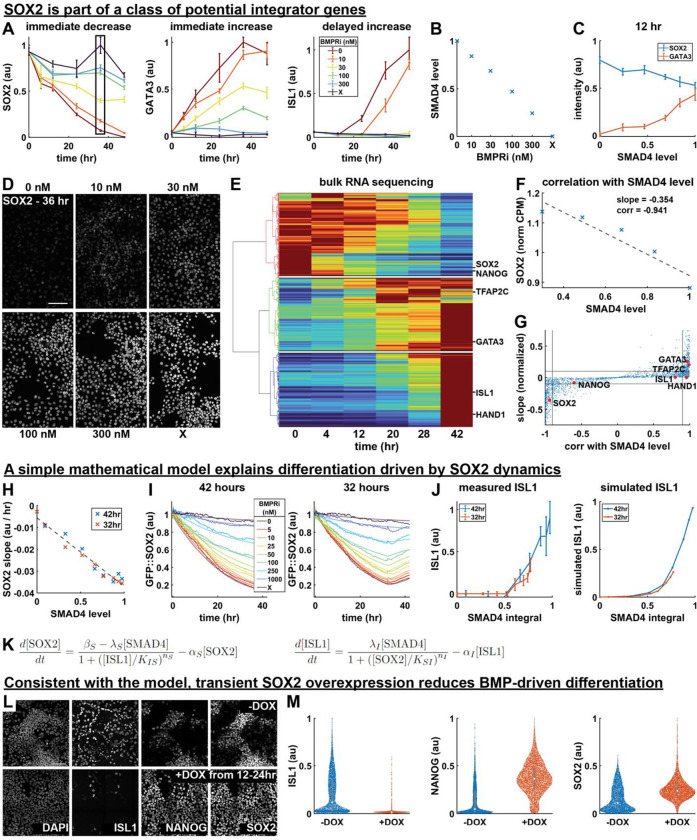
Figure 5: BMP signaling is integrated by SOX2.
(A) Normalized expression of SOX2, GATA3, and ISL1 over time for different signaling levels, measured with time-series IF. Error bars are standard deviation across images. A box outlined in black shows the data points corresponding to image data in 5D. (B) Average SMAD4 level for each treatment condition in 5A, determined using SMAD4 dynamics measured in the same conditions and shown in SI fig 5B. (C) SOX2 and GATA3 expression at 12 hours, plotted against SMAD4 signaling level. (D) Example IF image data for SOX2 in each treatment condition at 36 hours, corresponding to the points boxed in 5A. (E) Heatmap of time-series bulk RNA seq data (normalized counts per million) with genes on the y-axis ordered by hierarchical clustering. The cluster dendrogram is shown to the left, with lines colored for discrete cluster assignment, and white lines are drawn on the heatmap to separate clusters. The location in the heatmap of genes also measured with IF is indicated to the right. (F) Example bulk RNA seq dose-response data is shown for SOX2 with a linear least squares fit of SOX2 with respect to SMAD4 level. The slope of the least squares fit and the correlation coefficient between SOX2 and SMAD4 level are indicated. (G) Scatterplot of the slope of each gene with respect to SMAD4 and that gene’s correlation with SMAD4 in the dose-response bulk RNA seq data, as determined in 5F. The locations in the scatterplot of genes for which we also have IF data are indicated. (H) Plot of the slope of each GFP::SOX2 curve in SI fig 5G over the first 16 hours of differentiation against SMAD4 signaling level. SMAD4 level is determined in each condition based on data in Fig 4D. A dashed line indicates a linear fit of the data. (I) Measured (thick, solid lines) and simulated (thin, semi-transparent lines) GFP::SOX2 dynamics over the course of 42 hours of differentiation with indicated treatments applied for 42 (left) or 32 (right) hours. (J) Measured (left) and simulated (right) ISL1 level as a function of SMAD4 integral for the conditions in 5J. (K) Equations used to model the regulation of SOX2 and ISL1 by BMP-SMAD4 signaling, and their mutual inhibition. (L) Example IF data showing ISL1, SOX2, and NANOG expression after 42 hours of differentiation with 50ng/mL BMP4 + WNTi, with or without the addition of doxycycline from 12 to 24 hours. (M) Violin plots of measured ISL1, NANOG, and SOX2 expression levels in treatment conditions in 5L. All scale bars 100um.

