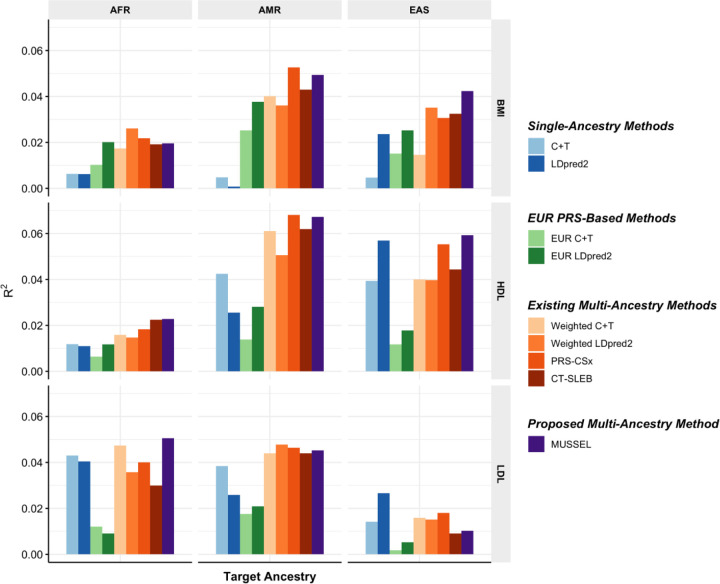
Figure 3: Prediction R2 on validation individuals of AFR (N=2,015–3,428), EAS (N=2,316–4,647), and AMR ancestries (N=3,479–4,397) in PAGE based on discovery GWAS from PAGE (AFR NGWAS=7,775 – 13,699, AMR NGWAS=13,894 – 17,558), BBJ (EAS NGWAS=70,657 – 158,284), and UKBB (EUR NGWAS=315,133 – 355,983).
We used genotype data from 1000 Genomes Project (498 EUR, 659 AFR, 347 AMR, 503 EAS, 487 SAS) as the LD reference dataset. All methods were evaluated on the ~2.0 million SNPs that are available in HapMap 3 + MEGA, except for PRS-CSx which is evaluated based on the HapMap 3 SNPs only, as implemented in their software. Ancestry- and trait-specific GWAS sample sizes, number of SNPs included, and validation sample sizes are summarized in Supplementary Table 3.1. A random half of the validation individuals is used as the tuning set to tune model parameters, as well as train the SL in CT-SLEB and MUSSEL or the linear combination model in weighted C+T, weighted LDpred2, and PRS-CSx. The other half of the validation set is used as the testing set to report R2 values for PRS on each ancestry, after adjusting for whether the sample is from BioMe and the top 10 genetic principal components for BMI, and additionally the age at lipid measurement and sex. The 95% bootstrap CIs of the estimated R2 are reported in Supplementary Figure 13 and Supplementary Table 9.

